Geodyn Solutions: ROI Comparison for Self-Sustaining Project Network with Incentives and Economic Impact
Geodyn Solutions proposes a $100 million investment, including a 15% contingency ($15 million), for a self-sustaining project network integrating shrimp/tilapia farms, feed factories, microbe labs, hemp/kenaf cultivation, and renewable energy systems. This analysis compares the return on investment (ROI), capital expenditure (CapEx), operational costs (OpEx), job creation, and economic impact in Mississippi, USA, versus the Dominican Republic, incorporating state, federal, grant, employer, tax, and green project incentives. Mississippi is selected for its low costs, waste availability, and robust incentives, while the Dominican Republic offers lower labor costs and export benefits. A 10-year revenue chart highlights year-by-year performance. Incentives reduce CapEx and OpEx, boosting ROI, with Mississippi outperforming due to higher revenue and economic benefits. This optimized comparison identifies Mississippi as the best location for profitability, sustainability, and scalability.
Project Overview
- Investment: $100M ($85M operational, $15M contingency).
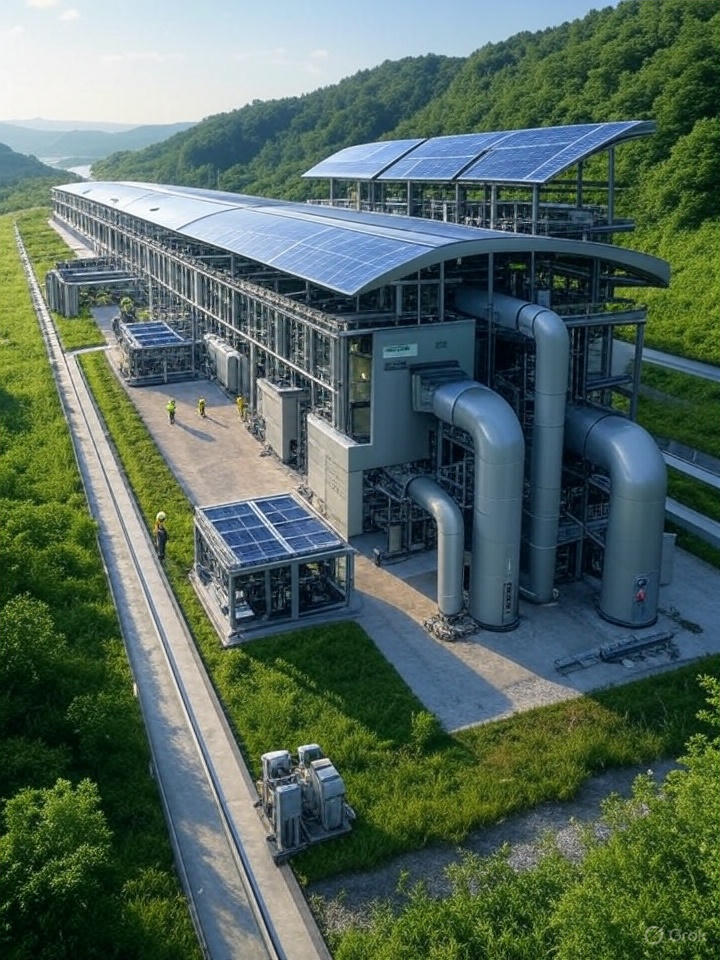
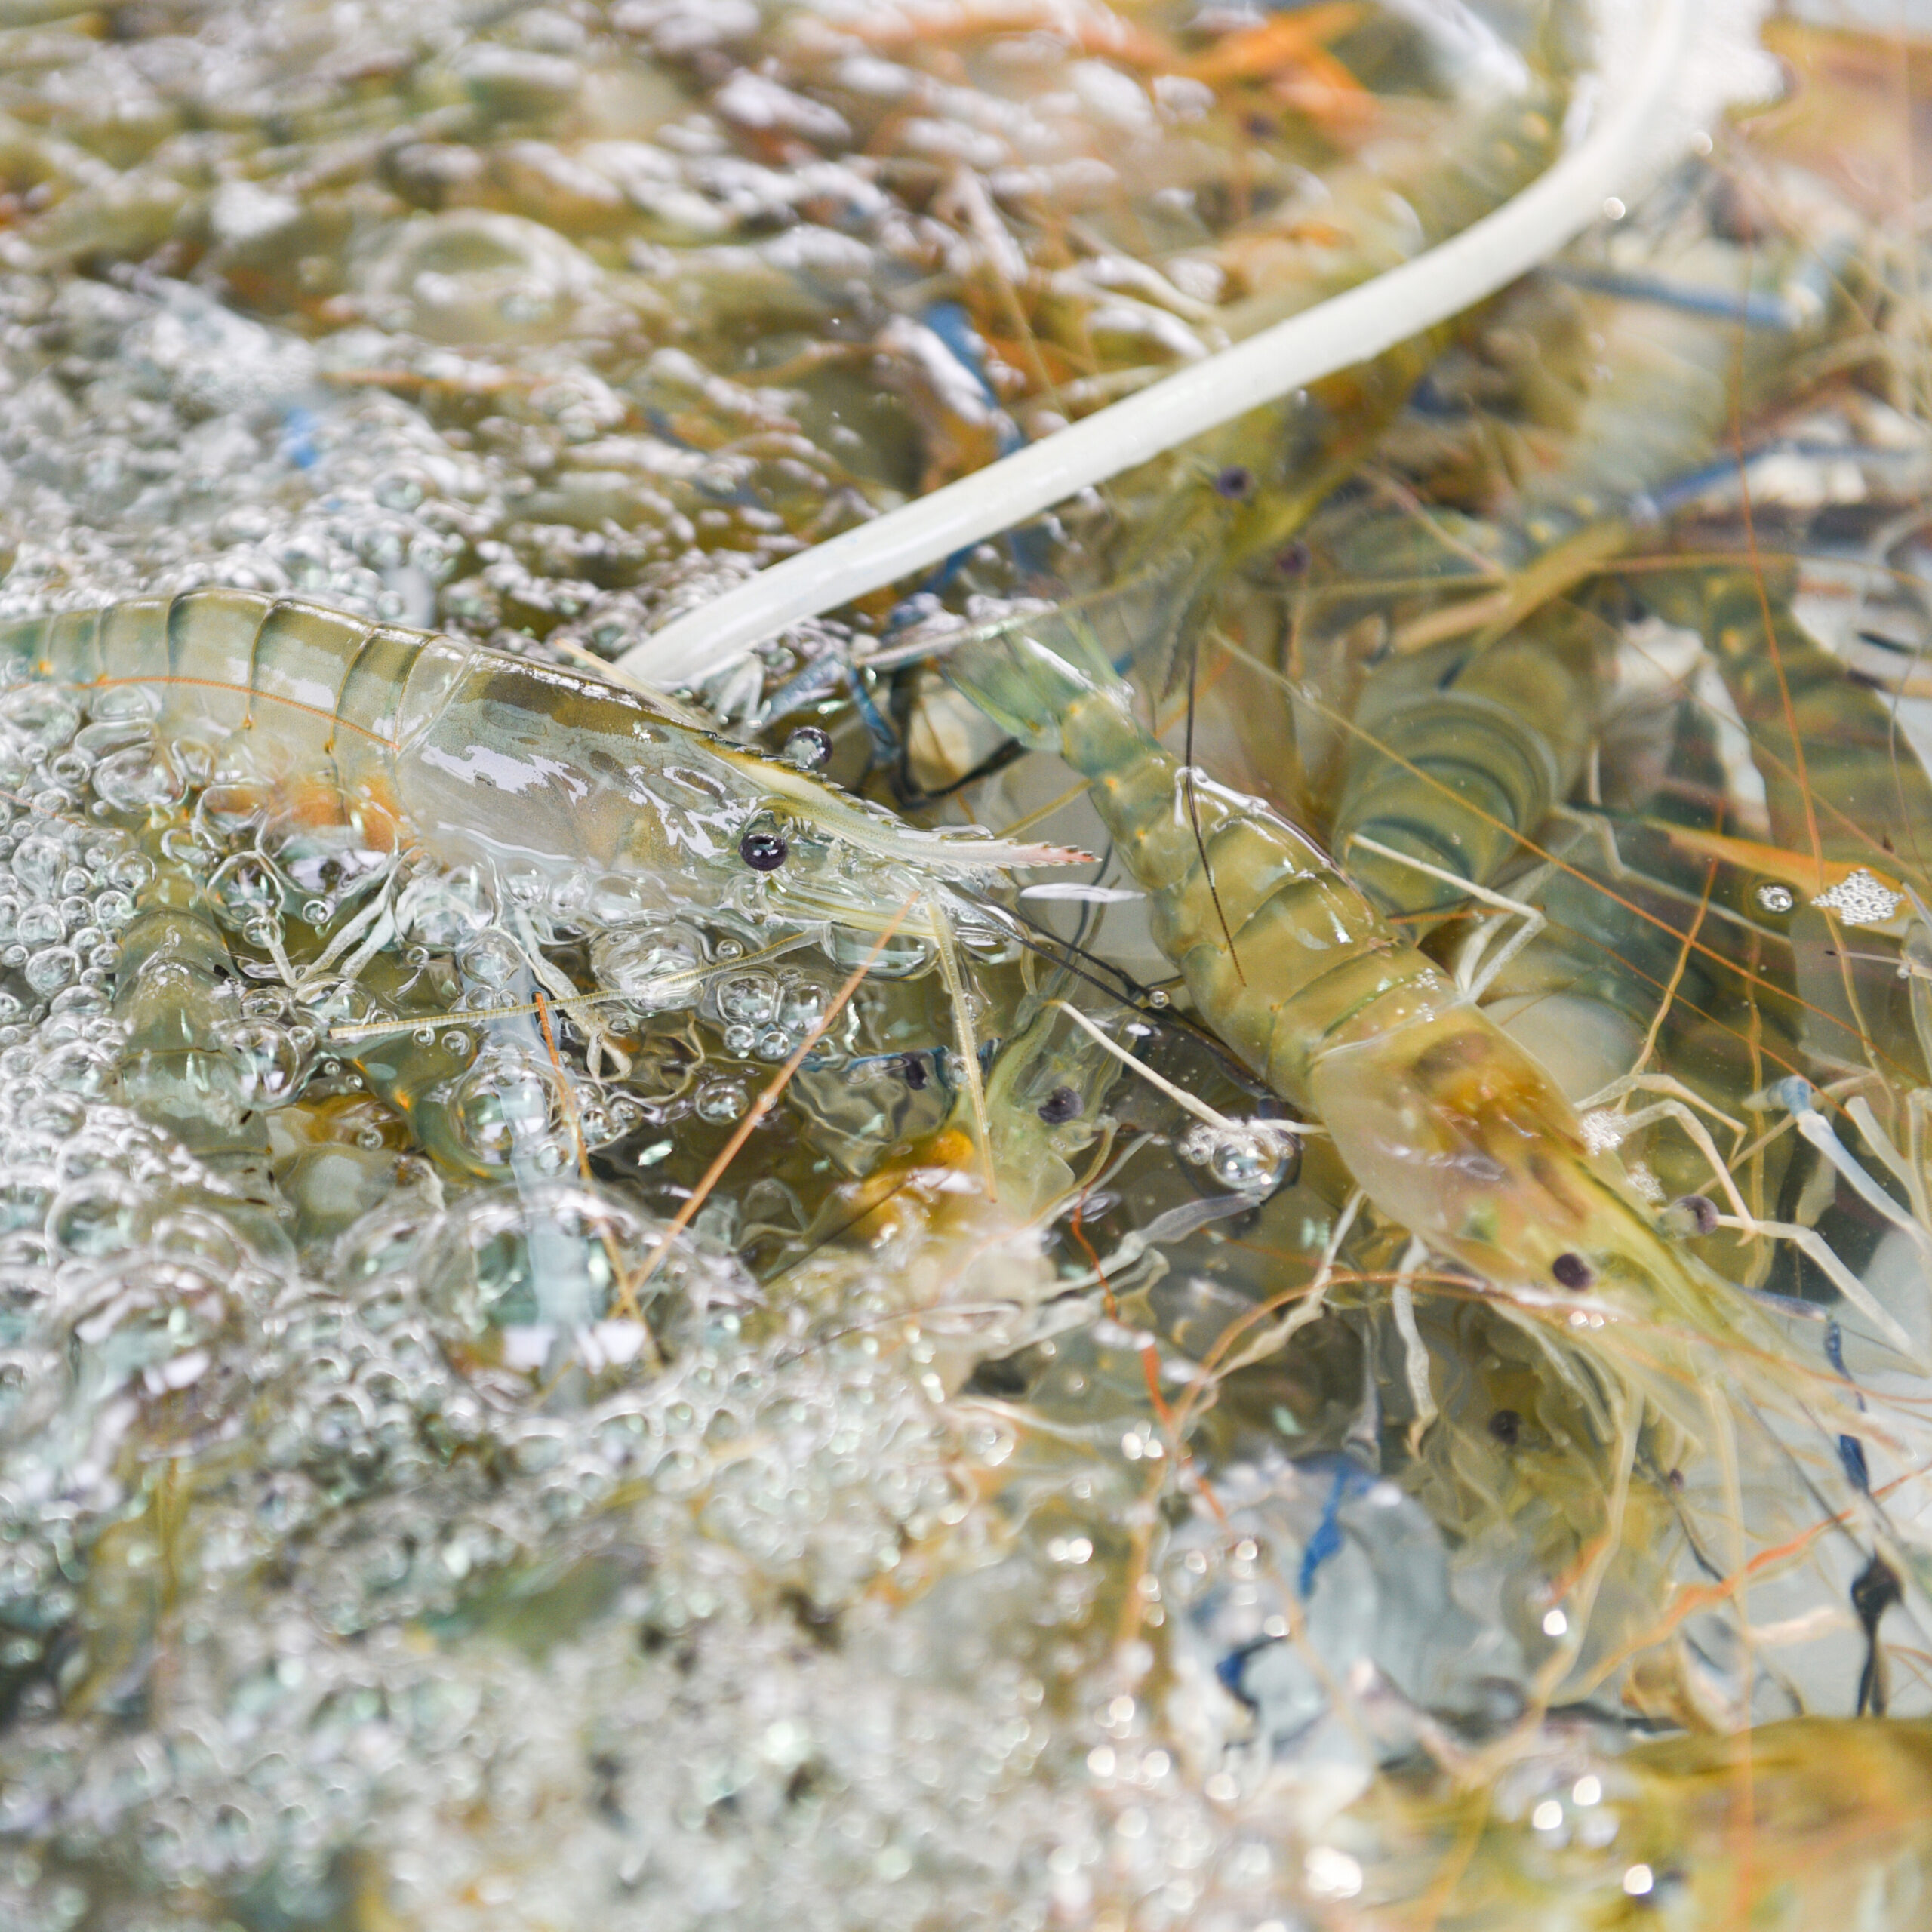
- Components: Shrimp/tilapia farms with processing, feed factories (black soldier fly, hemp seeds), microbe labs (biofertilizers, biopesticides, probiotics), hemp/kenaf cultivation (bioplastics, packaging), renewable energy (solar, pyrolysis with ORC).
- Sustainability: Utilize local waste (seafood, agricultural residues) to minimize external inputs.
- Profit Allocation (Post-Repayment): 30% repayment reserve, 30% profit distribution, 40% reinvestment.
Incentives
Mississippi, USA
- State Incentives (Mississippi Development Authority):
- Advantage Jobs Incentive: 4% payroll rebates for 10 years for jobs paying 125% of state average wage ($50,000/year). Estimated: $2M over 10 years (400 jobs by year 3).
- Tax Credits: 10% CapEx credit for aquaculture/renewable energy ($8.5M on $85M, one-time).
- Sales Tax Exemption: 100% on equipment/materials ($3M on $30M equipment).
- Federal Incentives:
- USDA Rural Development Grants: 25% of CapEx for energy/aquaculture ($5M on $20M energy, $3M on $30M farms, one-time).
- Investment Tax Credit (ITC): 30% on solar ($2.4M on $8M, one-time).
- EPA Green Project Grants: $2M for pyrolysis (one-time).
- Grants:
- World Bank Sustainable Agriculture Grant: $3M for biofertilizers/biopesticides (one-time).
- DOE Renewable Energy Grant: $2M for ORC/pyrolysis (one-time).
- Employer Incentives:
- Workforce Training Grants: $1,000/employee for biotech/aquaculture ($0.4M for 400 employees by year 3).
- Green Project Investment:
- Private ESG Funds: $5M low-interest loan (2% rate), saving $0.5M/year vs. 5% market rate.
- Total Incentives: $26.4M ($18.9M one-time, $2.5M over 10 years, $0.5M/year financing savings).
Dominican Republic
- National Incentives (Free Trade Zones, CEI-RD):
- Tax Exemptions: 100% income, import, export tax exemptions for 20 years ($5M/year on $20M revenue, $3M on $30M equipment).
- Land Lease Subsidies: 50% reduction on cooperative leases ($0.25M/year on $0.5M).
- Regional Incentives:
- CARICOM Export Grants: $2M for shrimp/feed exports (one-time).
- Grants:
- World Bank Sustainable Agriculture Grant: $3M for biofertilizers/biopesticides (one-time).
- UNDP Green Energy Grant: $2M for solar/pyrolysis (one-time).
- Employer Incentives:
- Ministry of Labor Training Subsidies: $500/employee ($0.25M for 500 employees by year 3).
- Green Project Investment:
- IDB Invest Green Bonds: $5M low-interest loan (1.5% rate), saving $0.55M/year vs. 5% market rate.
- Total Incentives: $21M ($15.25M one-time, $5.25M/year savings).
Location Analysis
Mississippi
- Climate: Warm (25–30°C), ideal for shrimp, tilapia, hemp/kenaf.
- Waste: 2M tons/year agricultural (soybean, corn), 100,000 tons seafood.
- Costs: Land $4,000/acre, labor $15–$20/hour.
- Market: Domestic demand (shrimp $12/kg, tilapia $3/kg), Gulf ports.
- Infrastructure: Reliable power, transport (I-55, Gulf ports).
Dominican Republic
- Climate: Tropical (26–32°C), optimal for shrimp, tilapia, hemp/kenaf.
- Waste: 5M tons sugarcane bagasse, 100,000 tons fish/shrimp waste, tires.
- Costs: Land via cooperatives ($0.5M/year), labor $2–$5/hour.
- Market: Export-driven (shrimp $10/kg, tilapia $2/kg), Caribbean/U.S.
- Infrastructure: Developing, supported by Free Trade Zones.
Financial Comparison
Capital Expenditure (CapEx)
- Mississippi:
- Shrimp/Fish Farms: $30M – $3M (USDA) – $3M (tax exemption) = $24M.
- Feed Factories: $15M – $1.5M (tax credit) = $13.5M.
- Microbe Labs: $15M – $1.5M (tax credit) = $13.5M.
- Hemp/Kenaf: $10M – $1M (tax credit) = $9M.
- Renewable Energy: $15M – $5M (USDA) – $2.4M (ITC) – $2M (EPA) = $5.6M.
- Grants: $5M (World Bank + DOE).
- Total Operational CapEx: $65.6M ($85M – $19.4M incentives).
- Contingency: $15M.
- Total with Incentives: $80.6M.
- Dominican Republic:
- Shrimp/Fish Farms: $25M – $2.5M (tax exemption) = $22.5M.
- Feed Factories: $15M – $1.5M (tax exemption) = $13.5M.
- Microbe Labs: $15M – $1.5M (tax exemption) = $13.5M.
- Hemp/Kenaf: $10M – $1M (tax exemption) = $9M.
- Renewable Energy: $20M – $2M (UNDP) = $18M.
- Grants: $5M (World Bank + CARICOM).
- Total Operational CapEx: $76M ($85M – $9M incentives).
- Contingency: $15M.
- Total with Incentives: $91M.
- Comparison: Mississippi’s CapEx is 11% lower ($80.6M vs. $91M) due to $10.4M more in one-time incentives.
Operational Costs (OpEx)
- Mississippi:
- Year 3: Shrimp/Fish Farms: $9.8M, Feed: $5M, Labs: $4M, Hemp/Kenaf: $2.5M, Energy: $1M, Financing Savings: -$0.5M = $21.8M.
- Years 4–6: $22.5M (5% labor/input cost increase).
- Years 7–10: $23M (2% increase, payroll rebates: $0.2M/year).
- Mitigation: Automation, waste recycling, biochar reduce costs by 15%.
- Dominican Republic:
- Year 3: Shrimp/Fish Farms: $7.9M, Feed: $4M, Labs: $3M, Hemp/Kenaf: $1.75M, Energy: $1.2M, Financing: -$0.55M, Tax Exemptions: -$5M = $12.3M.
- Years 4–6: $12.8M (5% increase).
- Years 7–10: $13.3M (4% increase, sustained tax exemptions).
- Mitigation: Cooperatives, waste recycling reduce inputs by 20%.
- Comparison: DR’s OpEx is 44% lower in year 3 due to tax exemptions and cheaper labor/land.
Revenue (10-Year Chart)
Year | Mississippi Revenue ($M) | Mississippi Profit ($M) | DR Revenue ($M) | DR Profit ($M) |
|---|---|---|---|---|
1 | 0 | -10 (setup) | 0 | -8 (setup) |
2 | 10 (shrimp/tilapia) | -11.8 (-21.8 OpEx) | 10 | -2.3 (-12.3) |
3 | 35.25 (full operations) | 13.45 | 22.75 | 10.45 |
4 | 38 (8% growth) | 15.5 (-22.5 OpEx) | 25 (10% growth) | 12.2 (-12.8) |
5 | 41 (8% growth) | 18.5 | 27.5 | 14.7 |
6 | 45 (scaled farms/labs) | 22.5 (-22.5 OpEx) | 30 | 17.2 (-12.8) |
7 | 48 (6% growth) | 25 (-23 OpEx) | 33 | 19.7 (-13.3) |
8 | 51 (6% growth) | 28 | 36 | 22.7 |
9 | 54 (6% growth) | 31 | 39 | 25.7 |
10 | 57 (6% growth) | 34 | 42 | 28.7 |
- Mississippi Revenue: Starts at $10M (year 2, shrimp/tilapia), reaches $35.25M (year 3: shrimp $24M, tilapia $4.5M, feed $4M, biofertilizers $0.75M, bioplastics $2M). Grows 8% (years 4–5), 6% (years 7–10) with domestic demand. Scaled farms/labs add $4M by year 6.
- DR Revenue: Starts at $10M (year 2), reaches $22.75M (year 3: shrimp $15M, tilapia $3M, feed $3M, biofertilizers $0.75M, bioplastics $1M). Grows 10% (years 4–5, export markets), 8% (years 7–10). Scaled operations add $3M by year 6.
- Comparison: Mississippi’s revenue is 55% higher in year 3 ($35.25M vs. $22.75M) and 36% higher in year 10 ($57M vs. $42M) due to higher domestic pricing (shrimp $12/kg vs. $10/kg, tilapia $3/kg vs. $2/kg).
ROI Projections
- Mississippi:
- Years 1–3: Cumulative loss: -$8.35M ($19.4M incentives offset setup costs).
- Years 4–5: Cumulative profit: $47.45M ($13.45M + $15.5M + $18.5M).
- ROI Year 5: [(47.45M / 80.6M) × 100] / 5 = 11.8% annually, 58.9% cumulative.
- Years 6–10: Cumulative profit: $188.95M ($47.45M + $22.5M + $25M + $28M + $31M + $34M).
- ROI Year 10: [(188.95M / 80.6M) × 100] / 10 = 23.4% annually, 234% cumulative.
- Repayment: $80.6M by year 5.
- Dominican Republic:
- Years 1–3: Cumulative loss: $0.15M ($9M incentives offset costs).
- Years 4–5: Cumulative profit: $37.35M ($10.45M + $12.2M + $14.7M).
- ROI Year 5: [(37.35M / 91M) × 100] / 5 = 8.2% annually, 41% cumulative.
- Years 6–10: Cumulative profit: $161.35M ($37.35M + $17.2M + $19.7M + $22.7M + $25.7M + $28.7M).
- ROI Year 10: [(161.35M / 91M) × 100] / 10 = 17.7% annually, 177% cumulative.
- Repayment: $91M by year 6.
- Comparison: Mississippi achieves 44% higher ROI by year 5 (58.9% vs. 41%) and 32% higher by year 10 (234% vs. 177%) due to lower CapEx ($80.6M vs. $91M) and higher revenue.
Job Creation and Economic Impact
- Mississippi:
- Phase 1 (Years 1–3): 400 jobs (farms: 150, processing: 80, labs: 50, feed: 80, energy: 40). Wages: $8M/year ($20/hour).
- Phase 2 (Years 4–6): 800 jobs (farms: 300, processing: 150, labs: 80, feed: 150, energy: 80). Wages: $16M/year.
- Phase 3 (Years 7–10): 1,200 jobs (150 biotech/aquaculture specialists). Wages: $24M/year.
- Economic Benefits:
- Direct Impact: $120M in wages over 10 years (400–1,200 jobs).
- Indirect Impact: $180M (multiplier 1.5, local spending on goods/services).
- Community Benefits: Workforce training in biotech/aquaculture enhances skills; 75% local hiring reduces unemployment.
- Tax Revenue: $10M/year by year 5 (payroll/property taxes, post-incentives).
- Dominican Republic:
- Phase 1: 500 jobs (farms: 200, processing: 100, labs: 50, feed: 100, energy: 50). Wages: $1.5M/year ($3/hour).
- Phase 2: 1,000 jobs (farms: 400, processing: 200, labs: 100, feed: 200, energy: 100). Wages: $3M/year.
- Phase 3: 1,500–2,000 jobs (200 specialists). Wages: $4.5–$6M/year.
- Economic Benefits:
- Direct Impact: $37.5M in wages over 10 years (500–2,000 jobs).
- Indirect Impact: $56.25M (multiplier 1.5).
- Community Benefits: High job creation reduces poverty; training programs improve employability.
- Tax Revenue: Minimal due to Free Trade Zone exemptions.
- Comparison: DR creates 25–67% more jobs; Mississippi’s wages yield 3.2x higher direct economic impact ($120M vs. $37.5M) and 10x higher tax revenue ($10M/year vs. $0M).
Sustainability Metrics
- Mississippi: 40,000 tons/year waste diverted, 25,000 tons CO2e saved, 75% chemical reduction.
- Dominican Republic: 50,000 tons/year waste diverted, 30,000 tons CO2e saved, 80% chemical reduction.
- Comparison: DR diverts 25% more waste, saves 20% more CO2 due to diverse feedstocks.
Key Findings
Metric | Mississippi (Year 5 / Year 10) | Dominican Republic (Year 5 / Year 10) |
|---|---|---|
CapEx (Effective) | $80.6M ($100M – $19.4M) | $91M ($100M – $9M) |
OpEx (Year 3) | $21.8M/year | $12.3M/year |
Revenue (Year 3) | $35.25M/year | $22.75M/year |
Profit (Year 3) | $13.45M/year | $10.45M/year |
ROI | 58.9% / 234% (23.4% annually) | 41% / 177% (17.7% annually) |
Repayment | Year 5 | Year 6 |
Jobs | 800 / 1,200 | 1,000 / 1,500–2,000 |
Economic Impact | $300M ($120M direct + $180M indirect) | $93.75M ($37.5M + $56.25M) |
- Short-Term (Years 1–5): Mississippi outperforms with 44% higher ROI (58.9% vs. 41%) due to $10.4M more in CapEx incentives and faster repayment (year 5 vs. 6).
- Long-Term (Years 6–10): Mississippi maintains 32% higher ROI (234% vs. 177%) with 36% higher revenue ($57M vs. $42M in year 10) and payroll rebates.
- Economic Benefits: Mississippi’s $300M impact (3.2x DR’s $93.75M) and $10M/year tax revenue enhance local prosperity; DR’s higher job creation addresses poverty but yields less economic value.
Recommendation
- Best ROI: Mississippi for short-term (58.9% ROI by year 5) and long-term (234% by year 10) due to $26.4M in incentives, higher revenue, and domestic market stability. Repayment by year 5 maximizes scalability and economic impact ($300M over 10 years).
- DR Advantage: Lower OpEx ($12.3M vs. $21.8M) and more jobs suit export-driven strategies, but lower ROI (41% by year 5, 177% by year 10) and incentives make it less optimal.
- Strategic Approach: Deploy in Mississippi to leverage incentives, revenue, and economic benefits. Reinvest 40% of profits to expand into DR for export markets, balancing cost advantages with Mississippi’s long-term profitability.