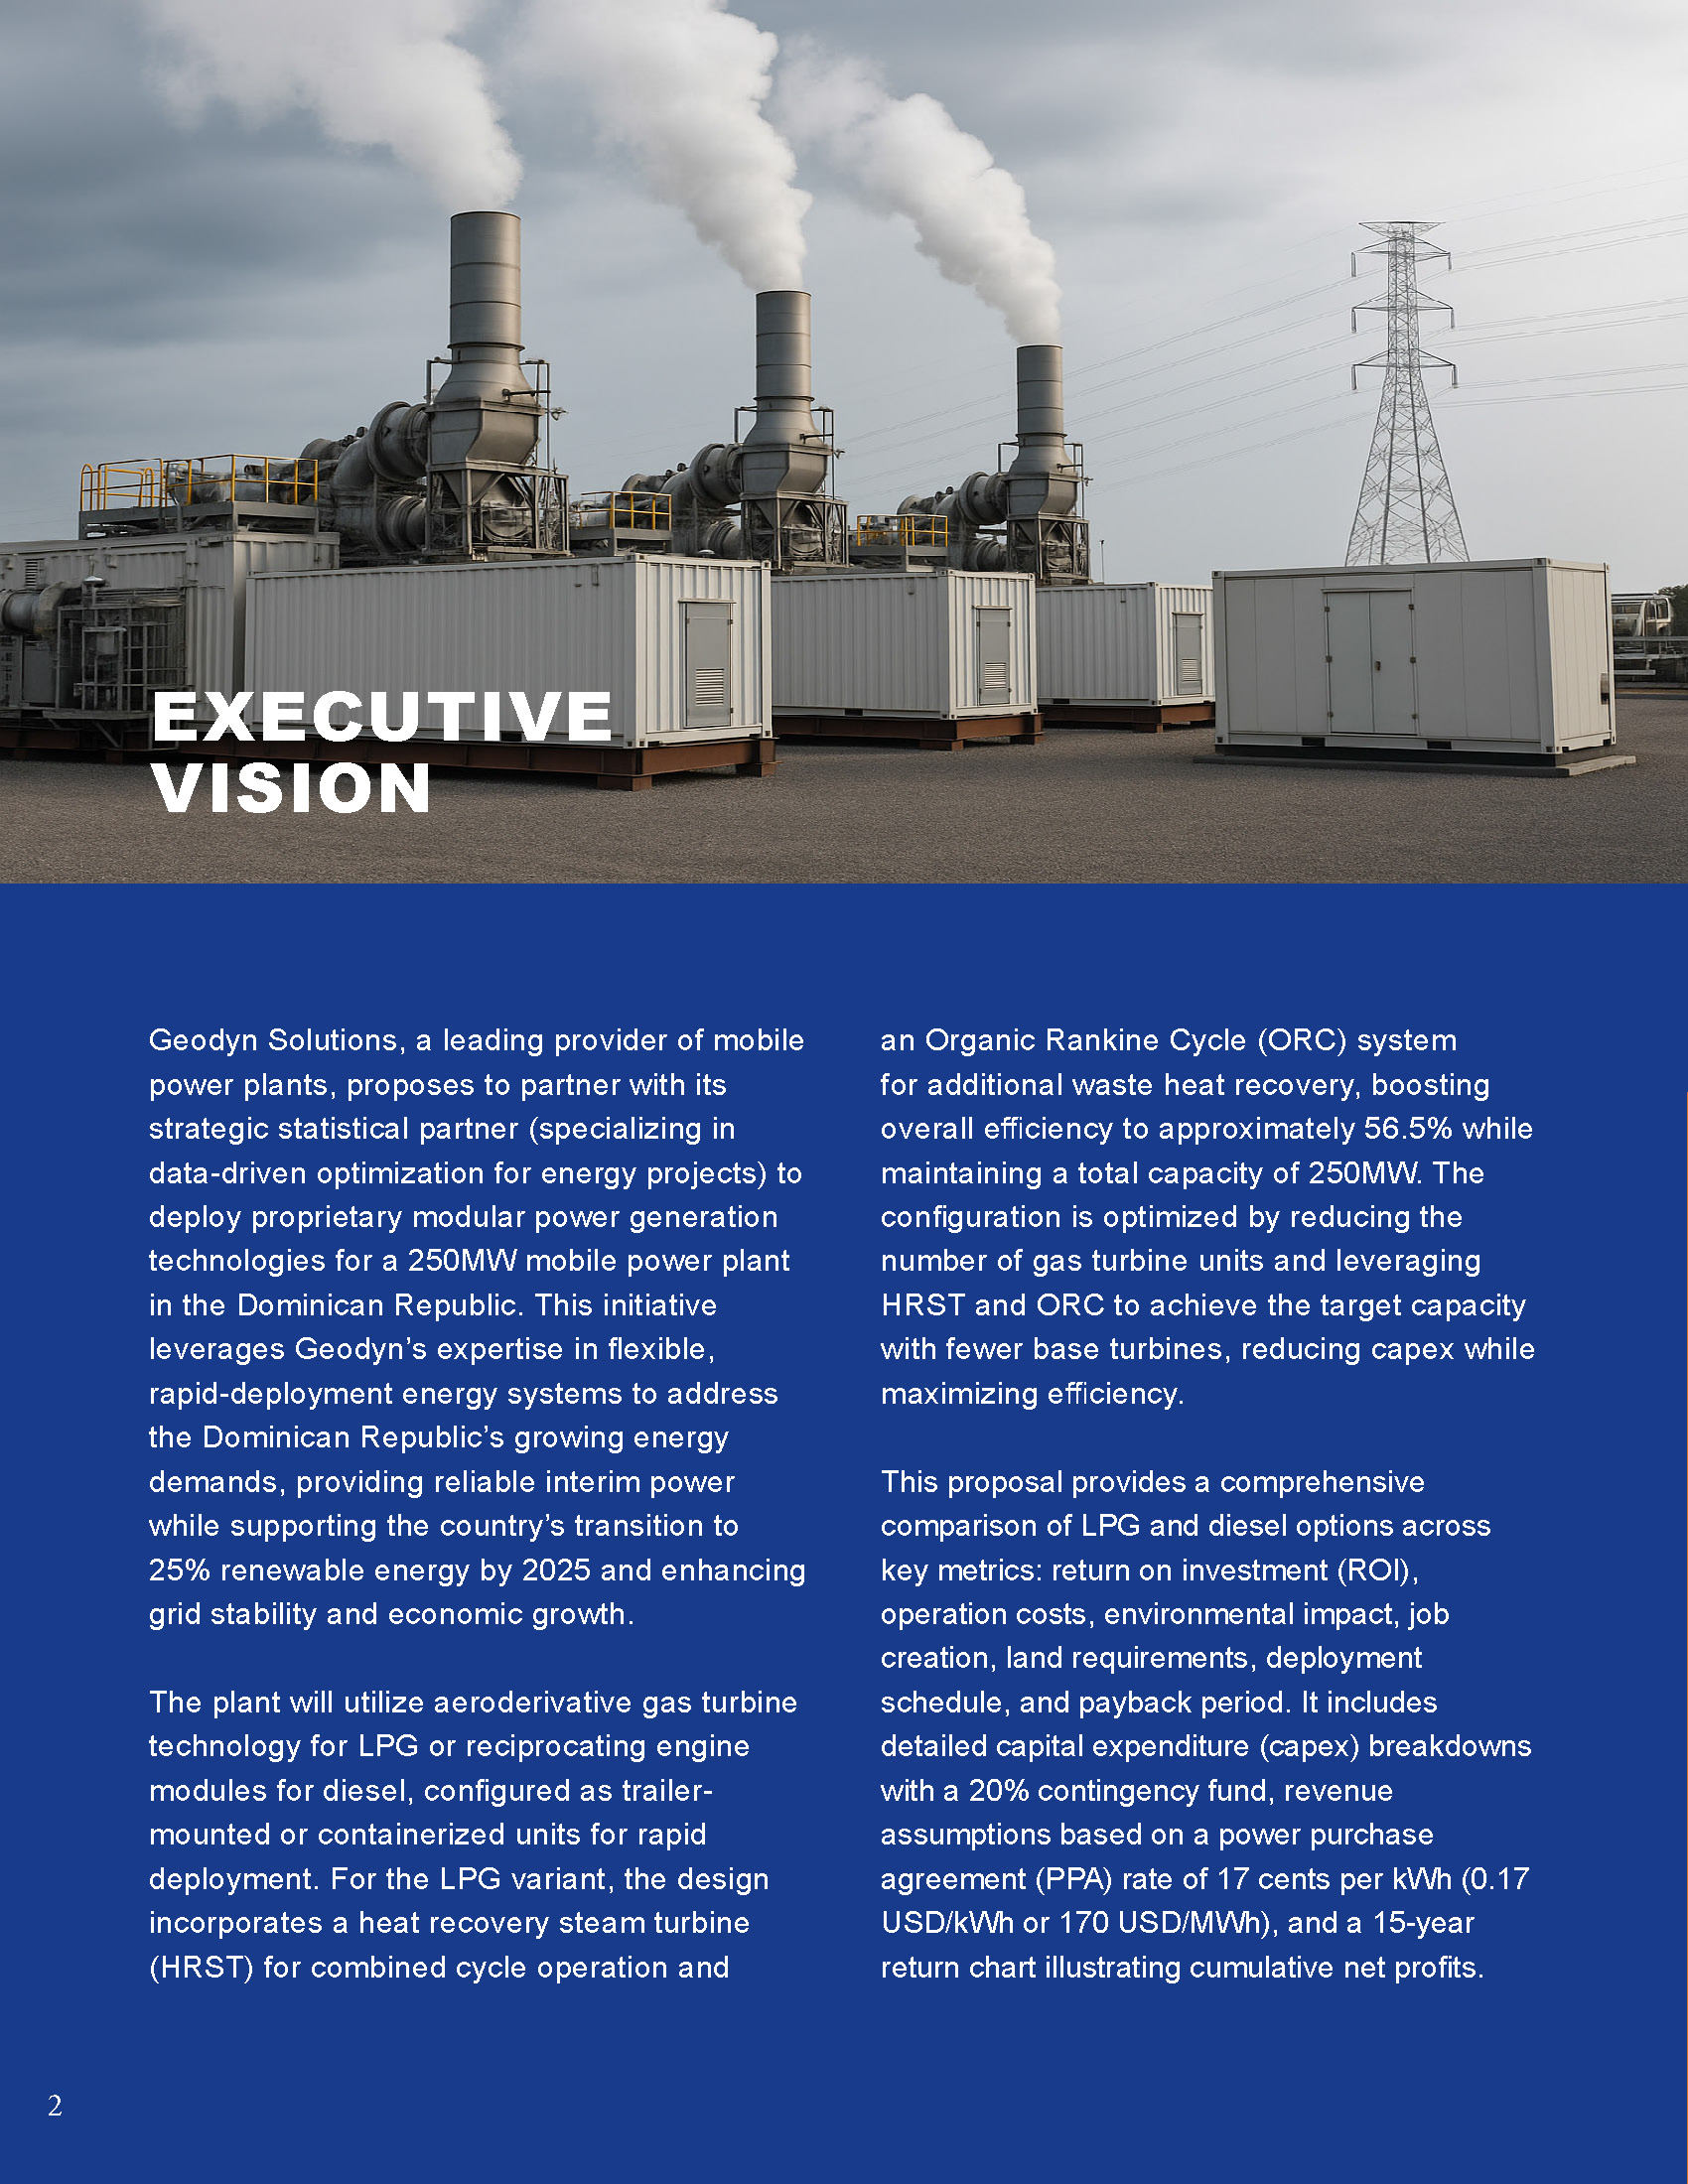
Geodyn Solutions 250MW Mobile Power Plant in the Dominican Republic

Project Overview
- Capacity factor: 70% (conservative for mobile units).
- Annual output: 1.533 million MWh (250 MW * 8760 hours/year * 70%).
- Annual revenue: 260.61 million USD (1.533 million MWh * 170 USD/MWh).
- Fuel prices (bulk, 2025 estimates in the Dominican Republic): LPG at 25 USD/MMBtu, diesel at 28 USD/MMBtu.
- Heat rates: LPG at 6,040 Btu/kWh (56.5% efficiency with HRST and ORC), diesel at 8,000 Btu/kWh (43% efficiency).
- Capital costs: LPG at 1,000 USD/kW (base 250 million USD total, optimized for fewer turbines with enhancements), diesel at 800 USD/kW (base 200 million USD total), with detailed breakdowns below, adjusted for incentives.
- Other opex: Includes labor (DR rates at ~0.56 USD/MWh), insurance, and administrative costs at ~7 USD/MWh for both options.
- Discount rate for ROI and payback: 10% for time value of money.
- Project lifespan: 15 years, with potential for extension or relocation.
- Incentives: Government tax exemptions reducing effective capex by 15%; World Bank financing (assumed 2% rate vs. market 8%, saving ~$4 million/year in interest); CO2 credits for LPG adding $5 million/year revenue.
- ETS participation: LPG’s lower emissions (~35% less CO2 than simple cycle) enhance credit sales or reduce compliance costs.
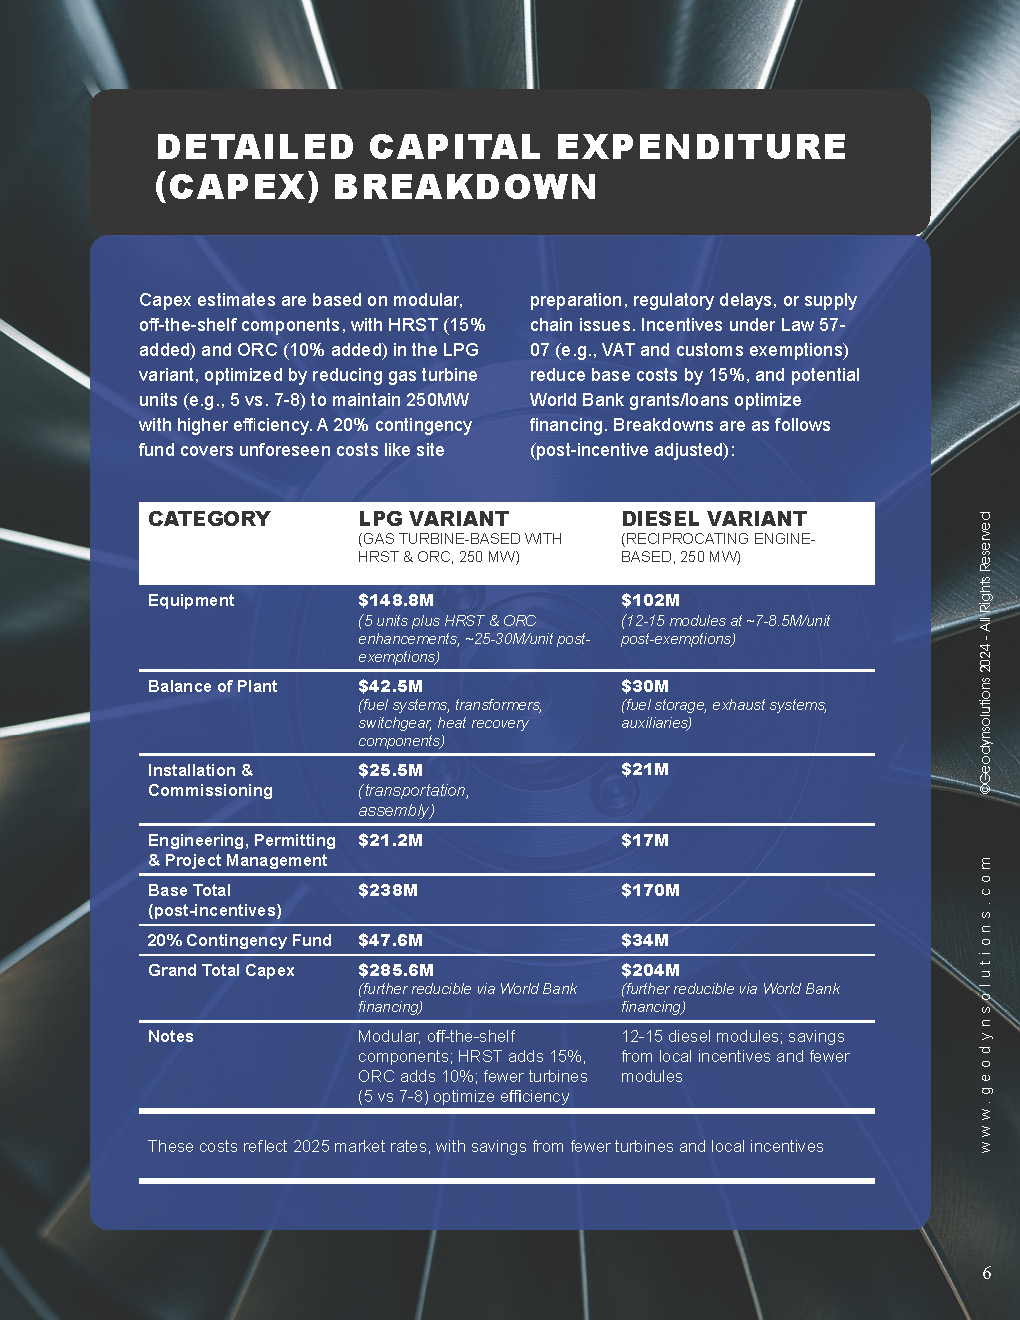
Detailed Capital Expenditure (Capex) Breakdown
Capex estimates are based on modular, off-the-shelf components, with HRST (15% added) and ORC (10% added) in the LPG variant, optimized by reducing gas turbine units (e.g., 5 vs. 7-8) to maintain 250MW with higher efficiency. A 20% contingency fund covers unforeseen costs like site preparation, regulatory delays, or supply chain issues. Incentives under Law 57-07 (e.g., VAT and customs exemptions) reduce base costs by 15%, and potential World Bank grants/loans optimize financing. Breakdowns are as follows (post-incentive adjusted):
| Category | LPG Variant (Gas Turbine-Based with HRST & ORC, 250 MW) | Diesel Variant (Reciprocating Engine-Based, 250 MW) |
|---|---|---|
| Equipment | 148.8 million USD (5 units + enhancements at ~25–30M each, post-exemptions) | 102 million USD (12–15 modules at ~7–8.5M each, post-exemptions) |
| Balance of Plant | 42.5 million USD (fuel systems, transformers, switchgear, heat recovery components) | 30 million USD (fuel storage, exhaust systems, auxiliaries) |
| Installation & Commissioning | 25.5 million USD (including transportation & assembly) | 21 million USD |
| Engineering, Permitting & Project Mgmt. | 21.2 million USD | 17 million USD |
| Base Total (post-incentives) | 238 million USD | 170 million USD |
| 20% Contingency Fund | 47.6 million USD | 34 million USD |
| Grand Total CAPEX | 285.6 million USD (further reducible by World Bank financing) | 204 million USD (further reducible by World Bank financing) |
These costs reflect 2025 market rates, with savings from fewer turbines in the LPG variant.
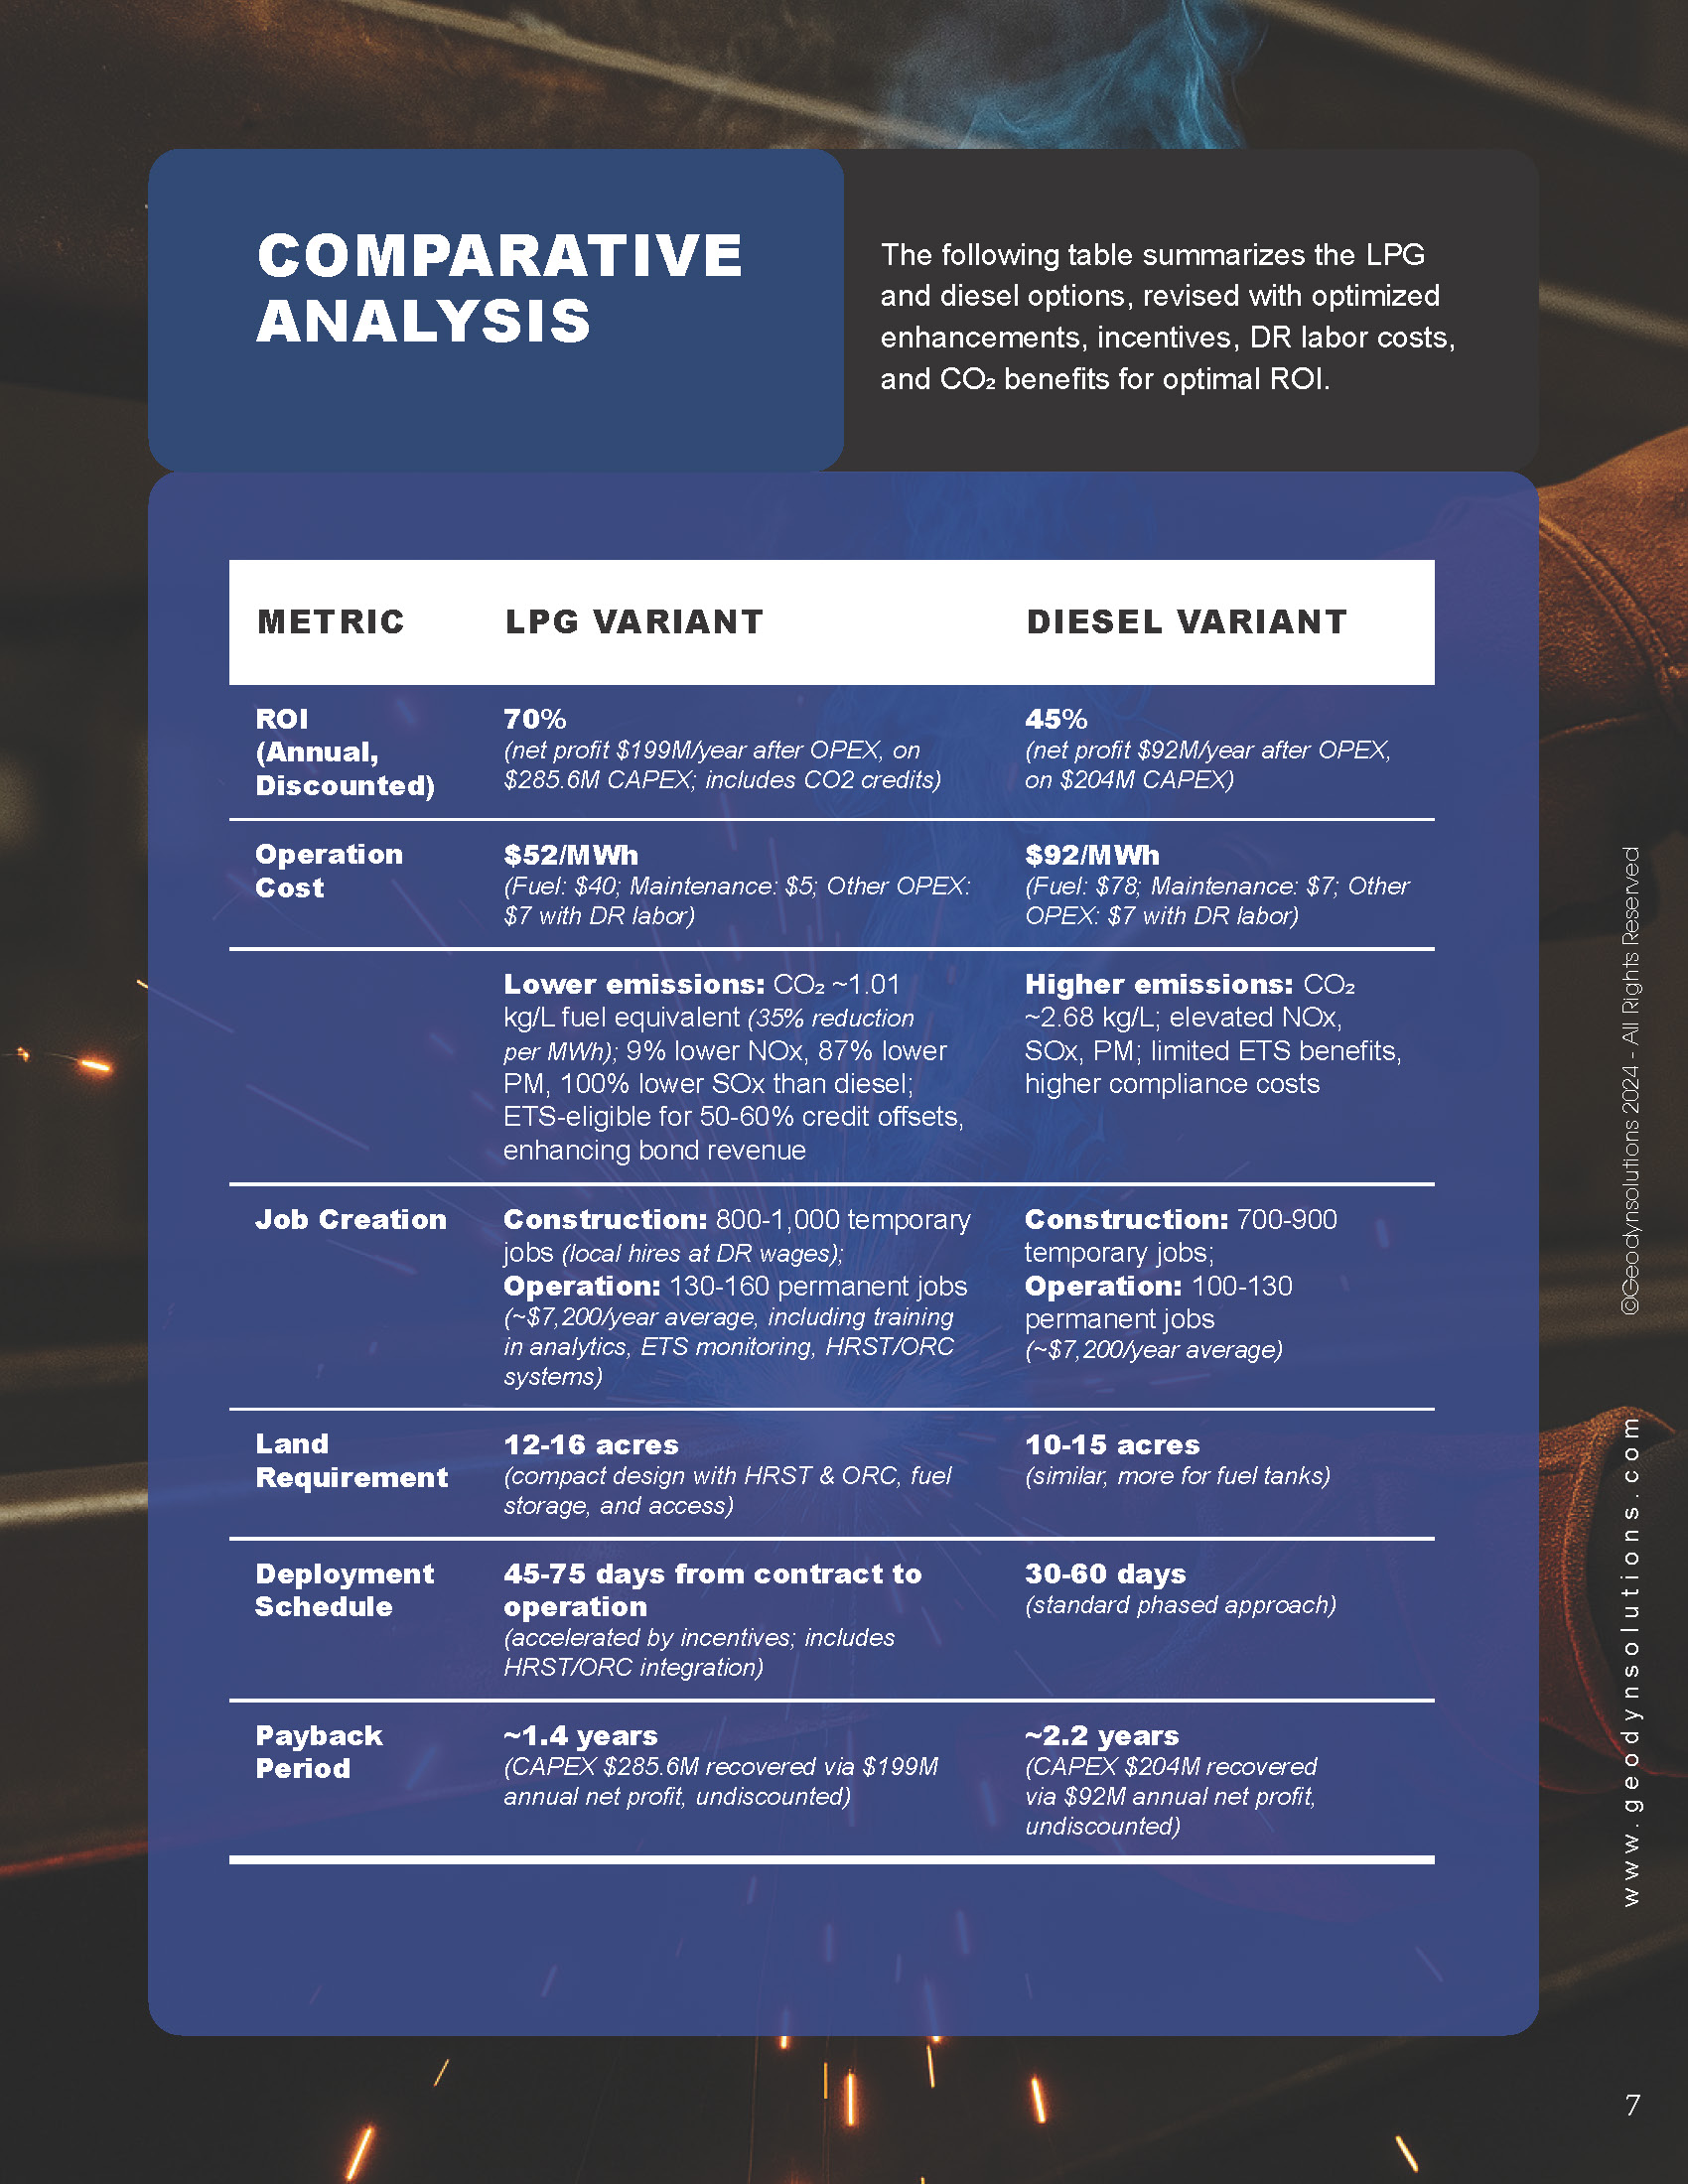
Comparative Analysis
The following table summarizes the LPG and diesel options, revised with optimized enhancements and DR labor costs for optimal ROI.
| Metric | LPG Variant | Diesel Variant |
|---|---|---|
| ROI (Annual, Discounted) | 70% (based on net profit of 199 million USD/year after opex, on 285.6 million USD capex; includes CO2 credits) | 45% (based on net profit of 92 million USD/year after opex, on 204 million USD capex) |
| Operation Cost | 52 USD/MWh (fuel: 40 USD/MWh; maintenance: 5 USD/MWh; other opex: 7 USD/MWh with DR labor) | 92 USD/MWh (fuel: 78 USD/MWh; maintenance: 7 USD/MWh; other opex: 7 USD/MWh with DR labor) |
| Environmental Impact | Lower emissions with CO2 ~1.01 kg/L fuel equivalent (35% reduction per MWh); 9% lower NOx, 87% lower PM, 100% lower SOx than diesel; ETS-eligible for 50-60% credit offsets, enhancing bond revenue. | Higher emissions with CO2 ~2.68 kg/L; elevated NOx, SOx, PM; limited ETS benefits, higher compliance costs. |
| Job Creation | Construction: 800-1,000 temporary jobs (local hires at DR wages); Operation: 130-160 permanent jobs (~$7,200 USD/year average, including training in analytics, ETS monitoring, and heat recovery systems). | Construction: 700-900 temporary jobs; Operation: 100-130 permanent jobs (~$7,200 USD/year average). |
| Land Requirement | 12-16 acres (compact design with space for HRST and ORC; includes fuel storage and access). | 10-15 acres (similar, but more for fuel tanks). |
| Deployment Schedule | 45-75 days from contract to operation (accelerated by incentives; includes HRST/ORC integration). | 30-60 days (standard phased approach). |
| Payback Period | ~1.4 years (285.6 million USD capex recovered via 199 million USD annual net profit, undiscounted). | ~2.2 years (204 million USD capex recovered via 92 million USD annual net profit, undiscounted). |
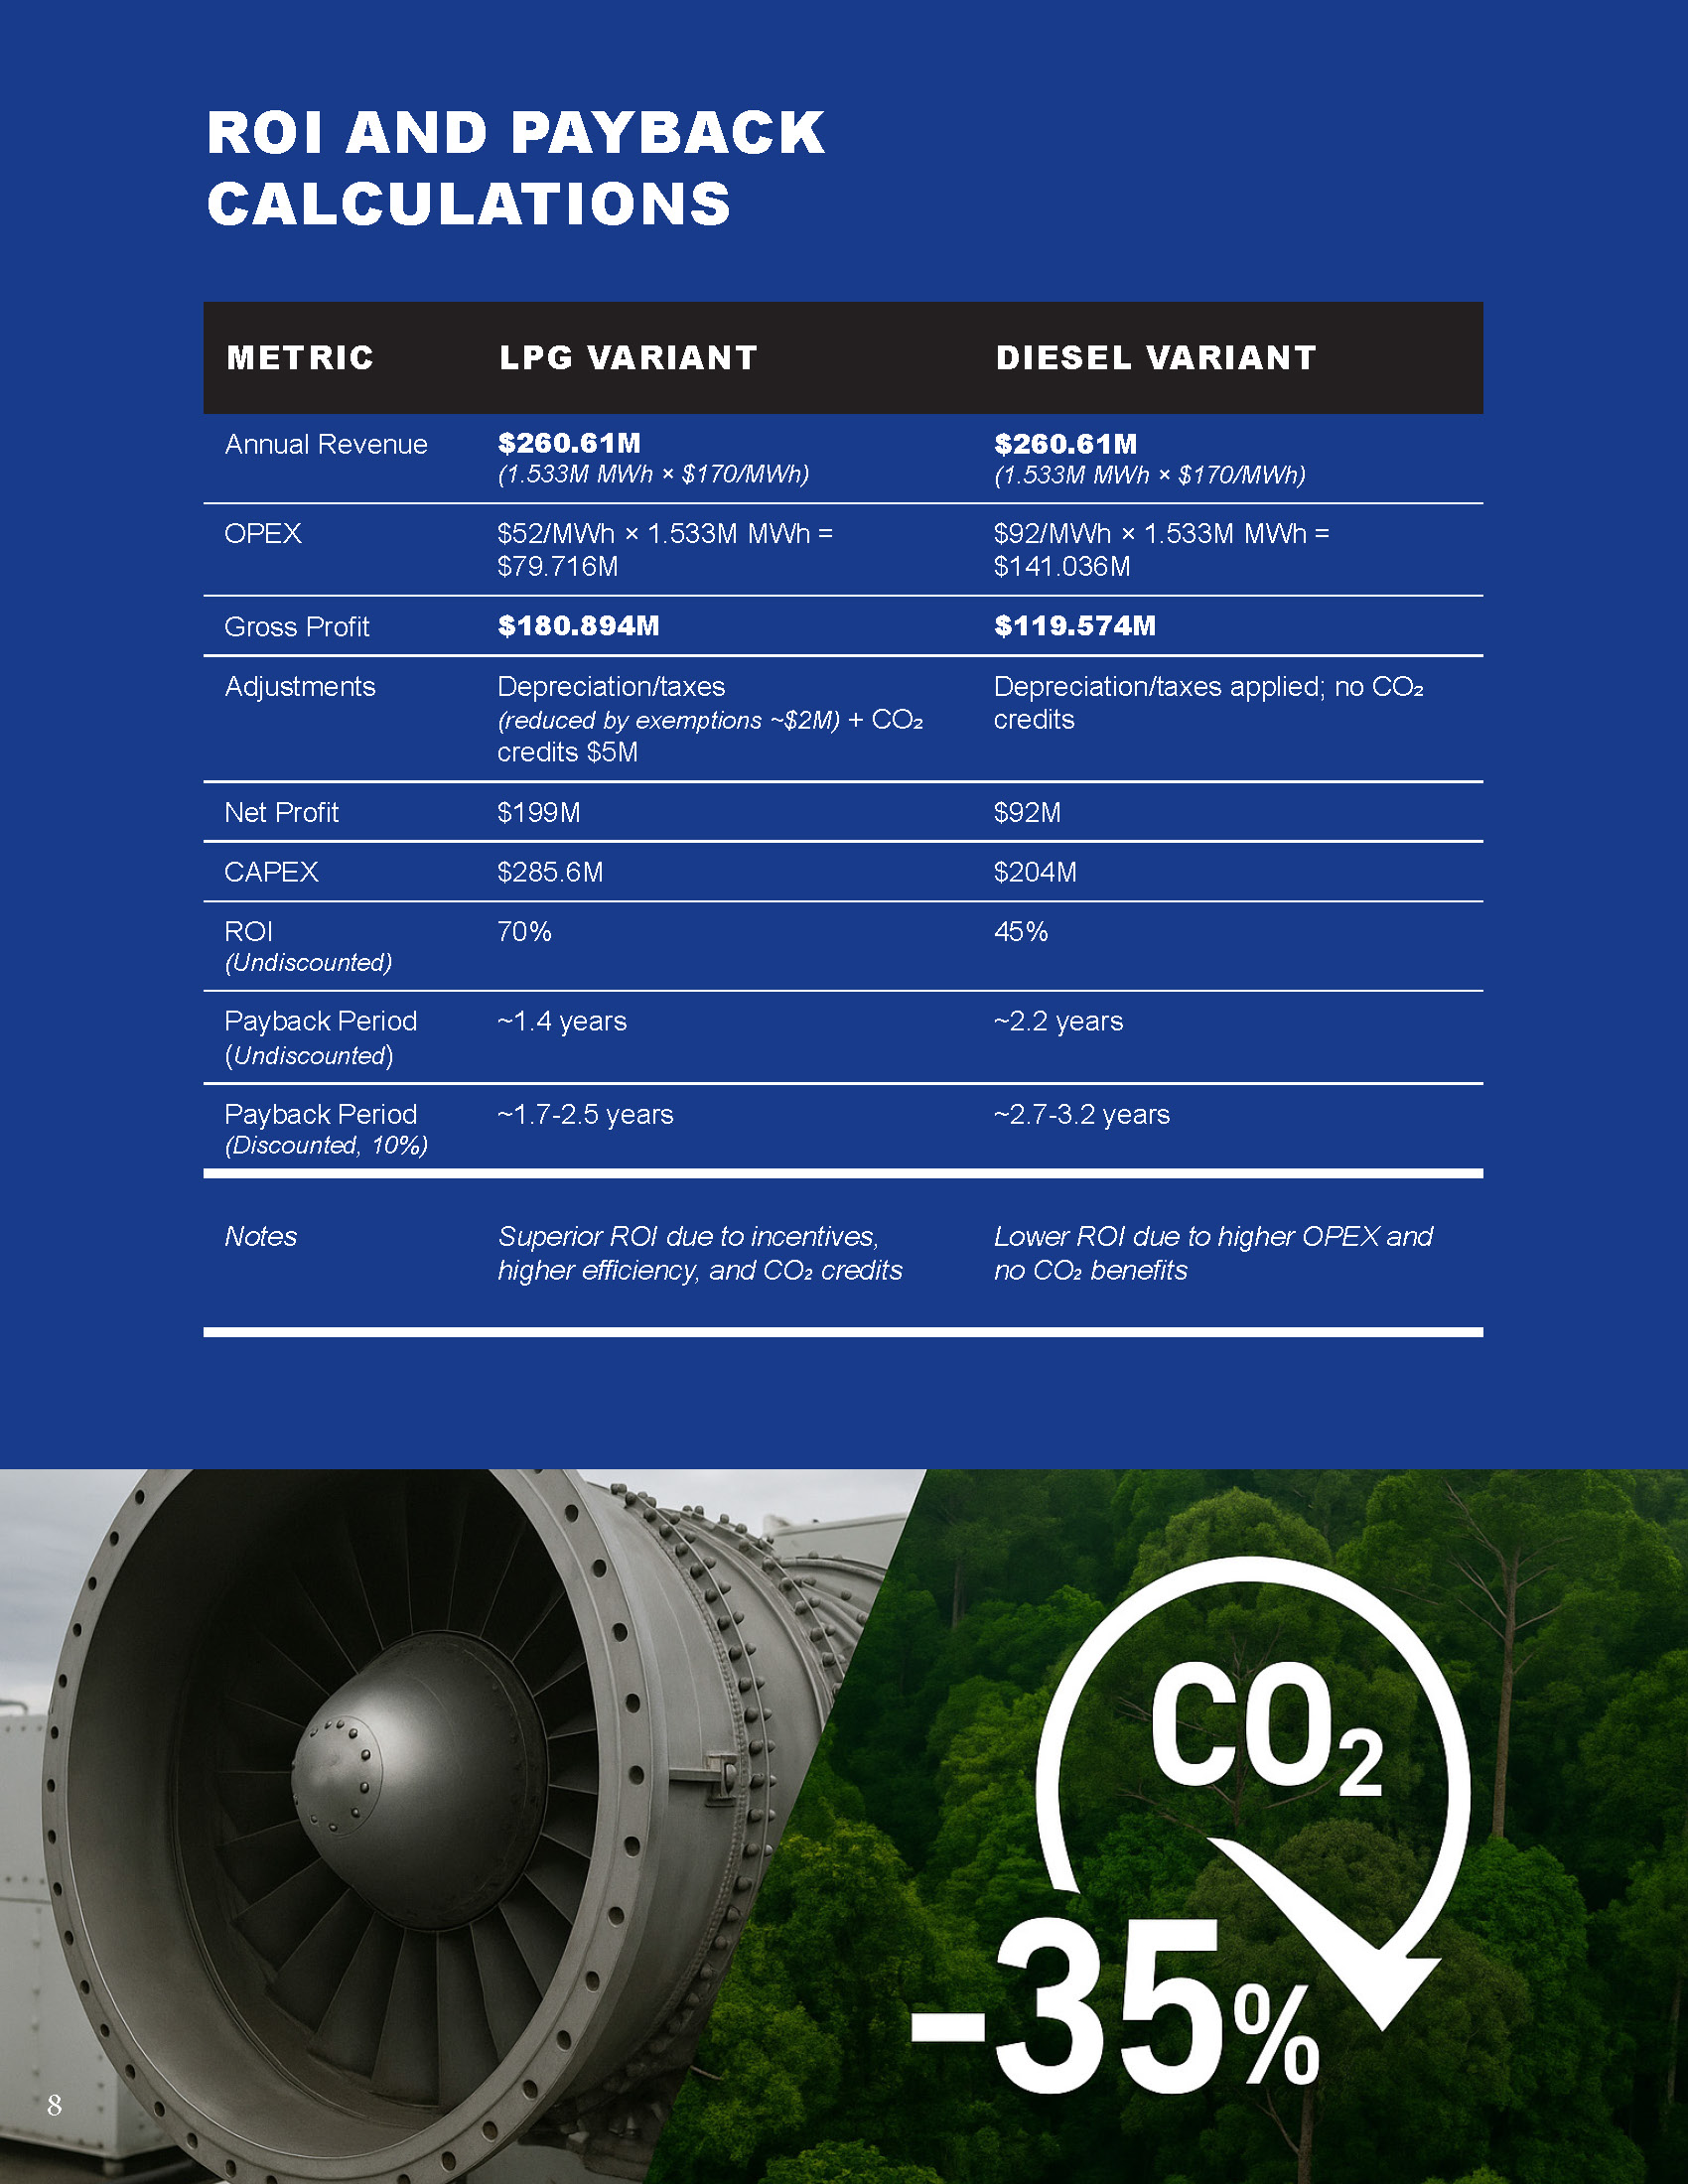
ROI and Payback Calculations
ROI is calculated as (annual net profit / capex) × 100, using discounted cash flows at 10%. Annual revenue is 260.61 million USD (1.533 million MWh * 170 USD/MWh). For LPG, opex is 52 USD/MWh * 1.533 million MWh = 79.716 million USD, yielding 180.894 million USD gross; after depreciation/taxes (reduced by exemptions, ~2 million USD) and +$5 million CO2 credits, net is 199 million USD. For diesel, opex is 92 USD/MWh * 1.533 million MWh = 141.036 million USD, gross 119.574 million USD, net 92 million USD after adjustments (no CO2 add). Payback is capex / annual net profit (undiscounted; discounted ~1.7-2.5 years). Sensitivity shows LPG superior with incentives and efficiency gains.
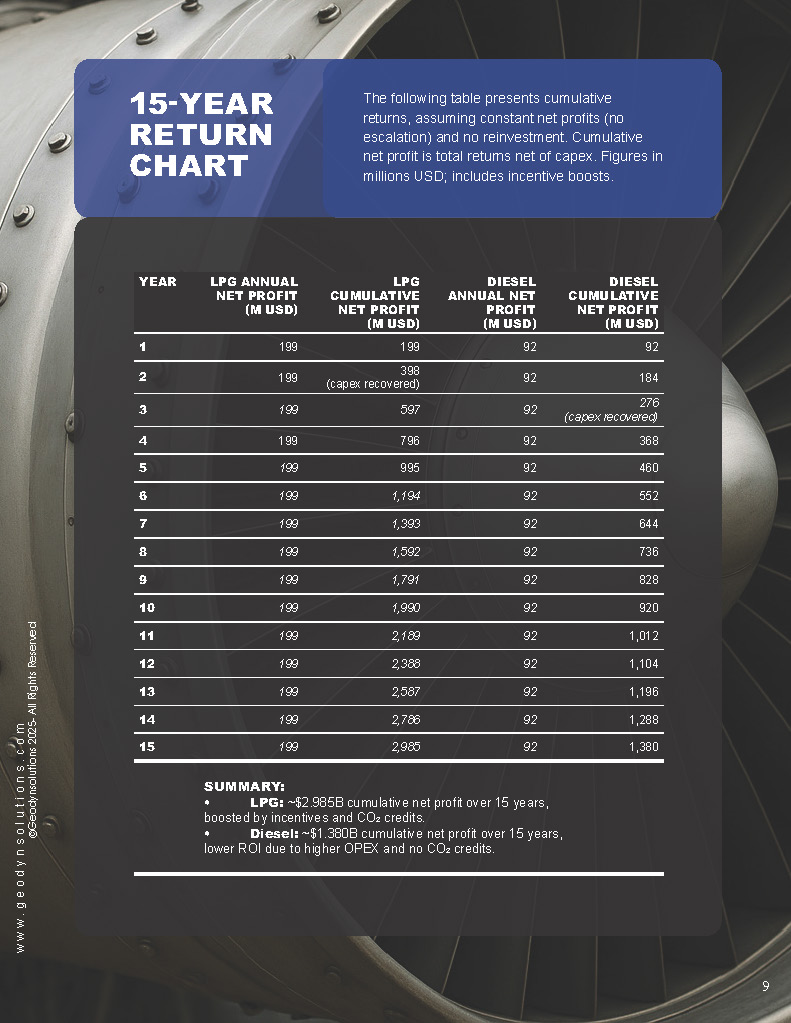
15-Year Return Chart
The following table presents cumulative returns, assuming constant net profits (no escalation) and no reinvestment. Cumulative net profit is total returns net of capex. Figures in millions USD; includes incentive boosts.
| Year | LPG Annual Net Profit | LPG Cumulative Net Profit | Diesel Annual Net Profit | Diesel Cumulative Net Profit |
|---|---|---|---|---|
| 1 | 199 | 199 | 92 | 92 |
| 2 | 199 | 398 (capex recovered) | 92 | 184 |
| 3 | 199 | 597 | 92 | 276 (capex recovered) |
| 4 | 199 | 796 | 92 | 368 |
| 5 | 199 | 995 | 92 | 460 |
| 6 | 199 | 1,194 | 92 | 552 |
| 7 | 199 | 1,393 | 92 | 644 |
| 8 | 199 | 1,592 | 92 | 736 |
| 9 | 199 | 1,791 | 92 | 828 |
| 10 | 199 | 1,990 | 92 | 920 |
| 11 | 199 | 2,189 | 92 | 1,012 |
| 12 | 199 | 2,388 | 92 | 1,104 |
| 13 | 199 | 2,587 | 92 | 1,196 |
| 14 | 199 | 2,786 | 92 | 1,288 |
| 15 | 199 | 2,985 | 92 | 1,380 |
Over 15 years, LPG yields ~2.985 billion USD in cumulative net profit, compared to 1.380 billion USD for diesel, enhanced by incentives and CO2 benefits.
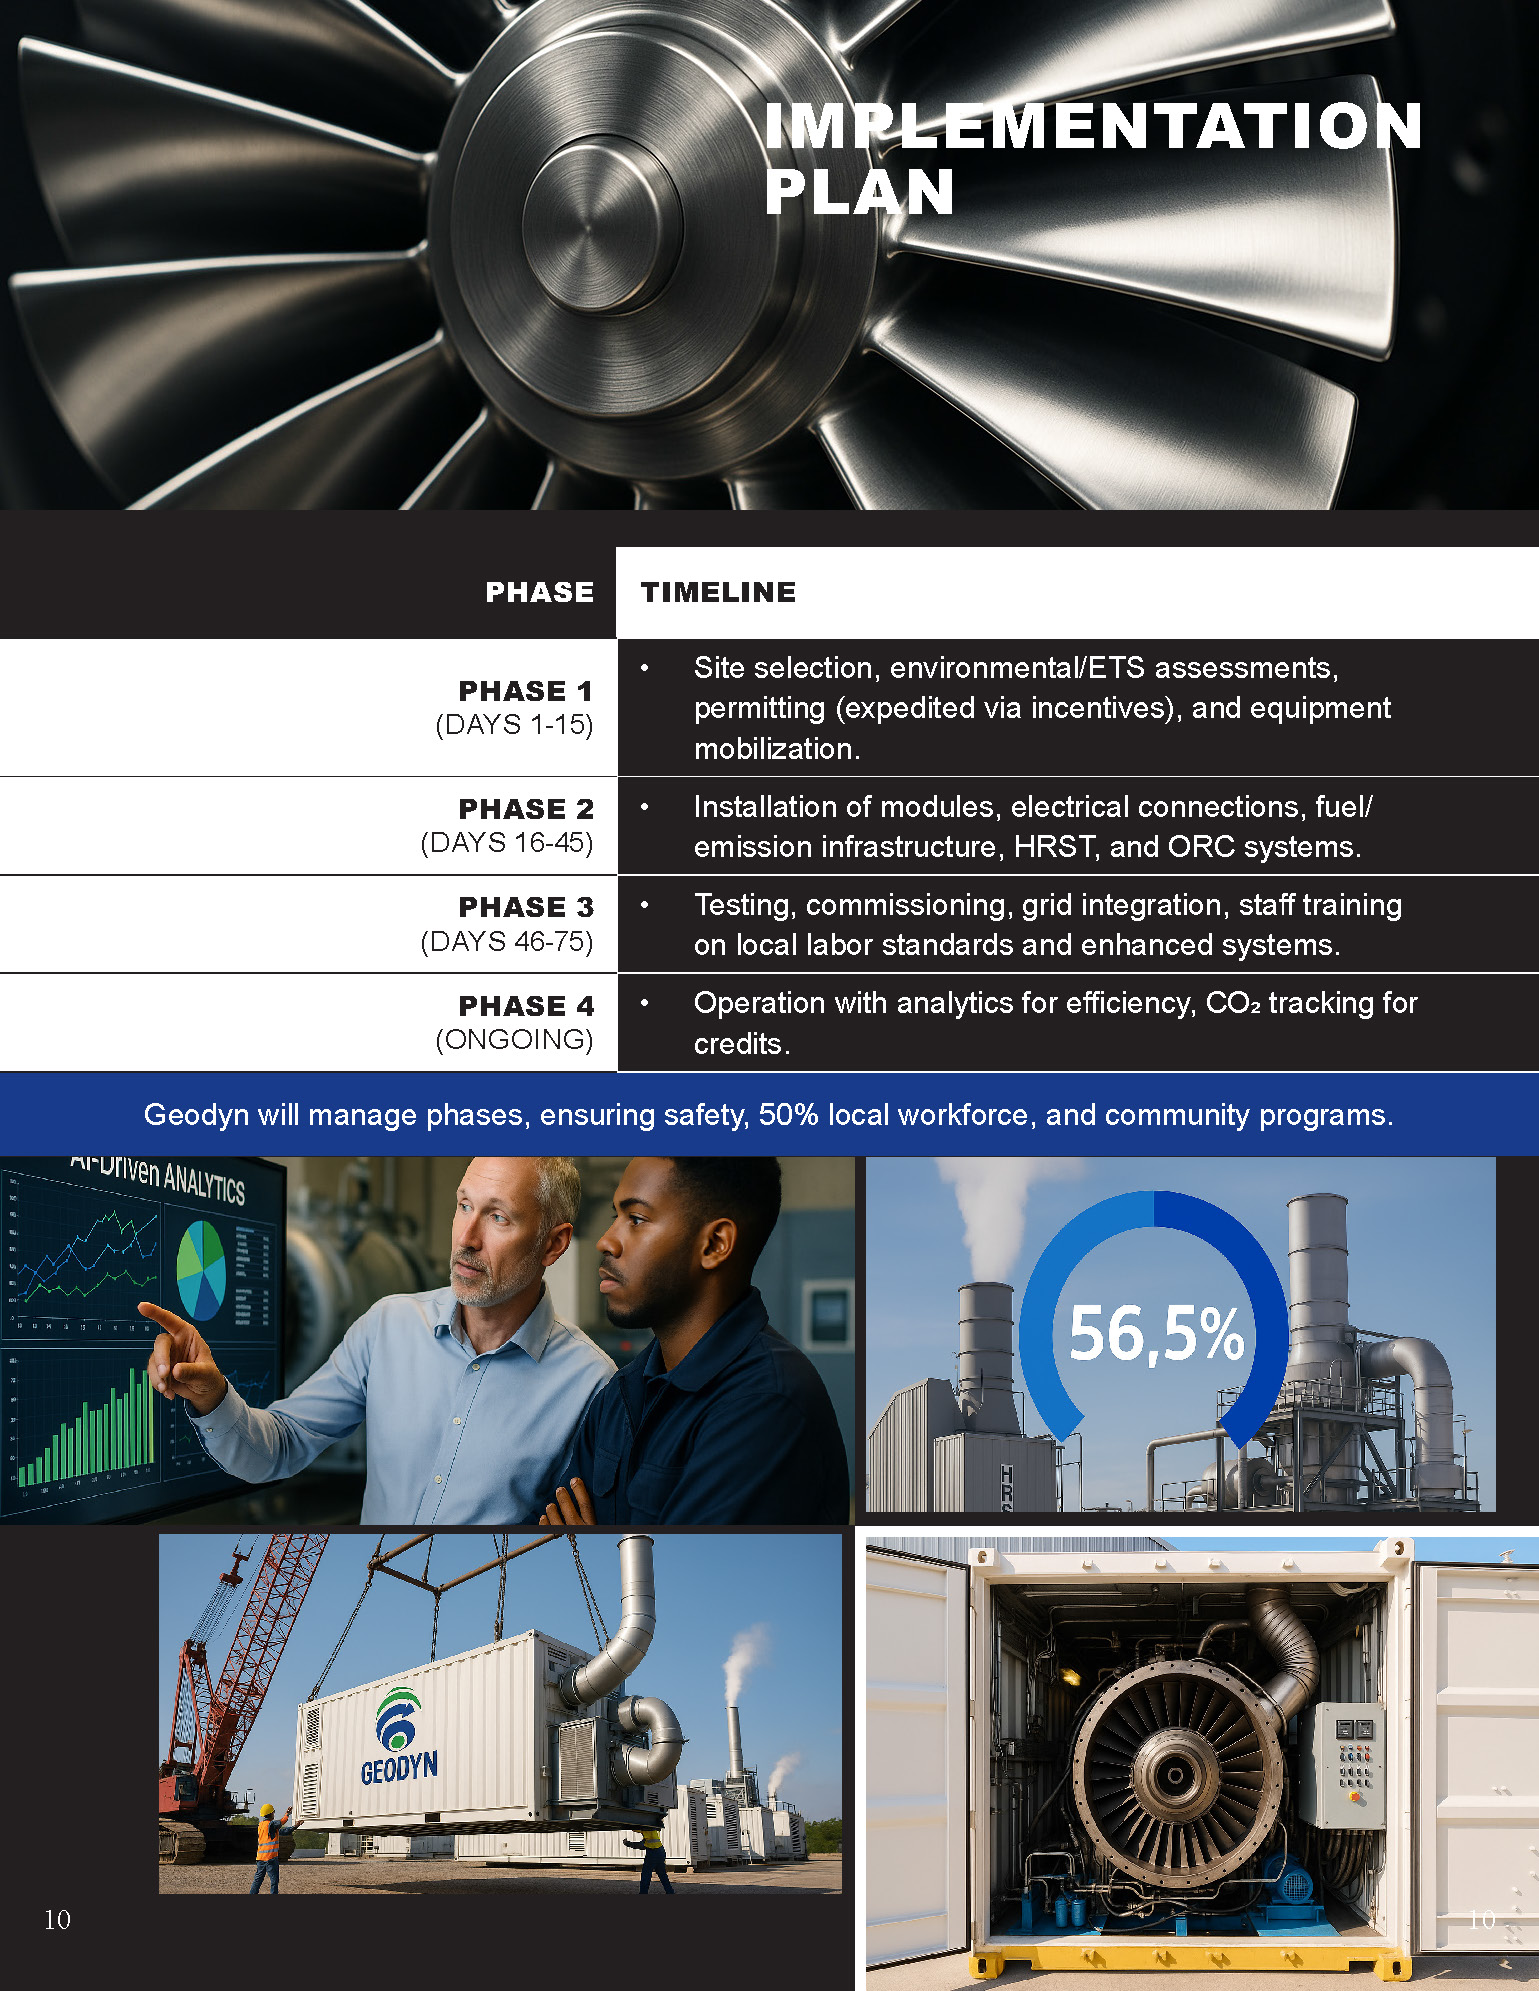
Implementation Plan
- Phase 1 (Days 1-15): Site selection, environmental assessments, permitting, and equipment mobilization.
- Phase 2 (Days 16-45): Installation of modules, electrical connections, fuel/emission infrastructure, HRST, and ORC systems.
- Phase 3 (Days 46-75): Testing, commissioning, grid integration, staff training on local labor standards and enhanced systems.
- Phase 4 (Ongoing): Operation with analytics for efficiency, CO2 tracking for credits.
Geodyn will manage phases, ensuring safety, 50% local workforce, and community programs.
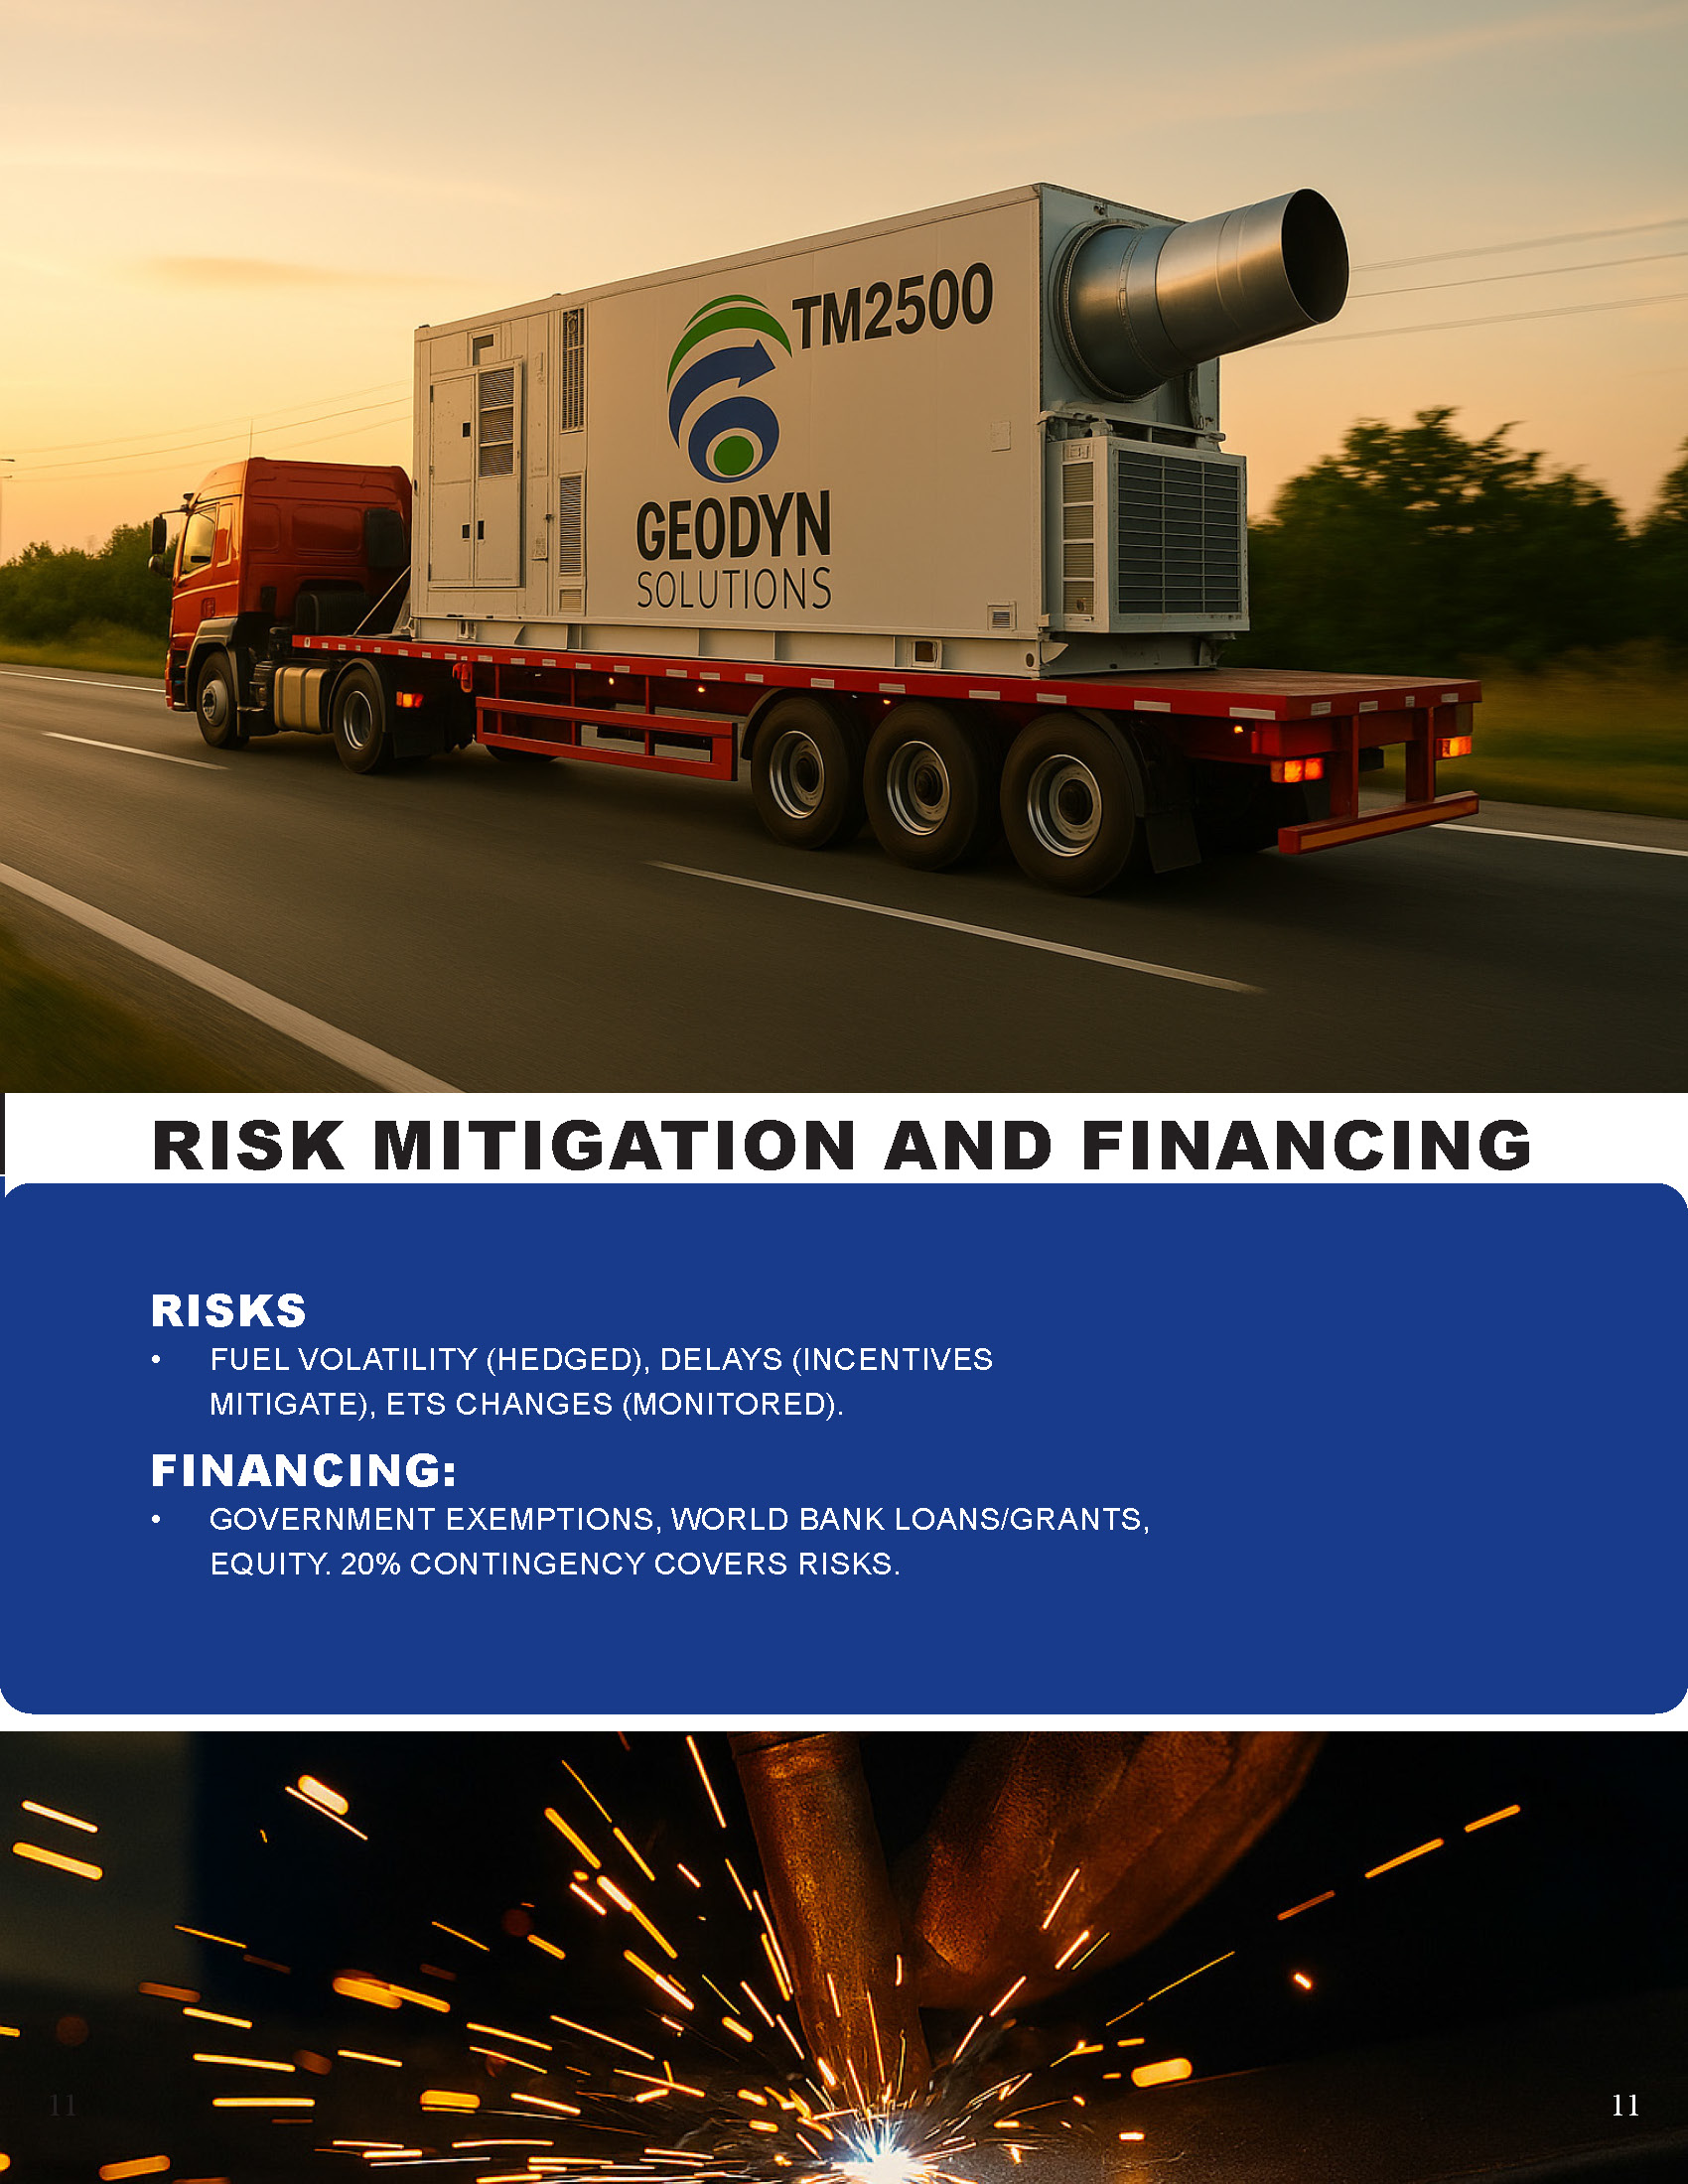
Risk Mitigation and Financing
Risks: Fuel volatility (hedged), delays (early stakeholder engagement), equipment issues (redundant modules). Financing: Project finance loans, equity partnerships. 20% contingency covers risks.
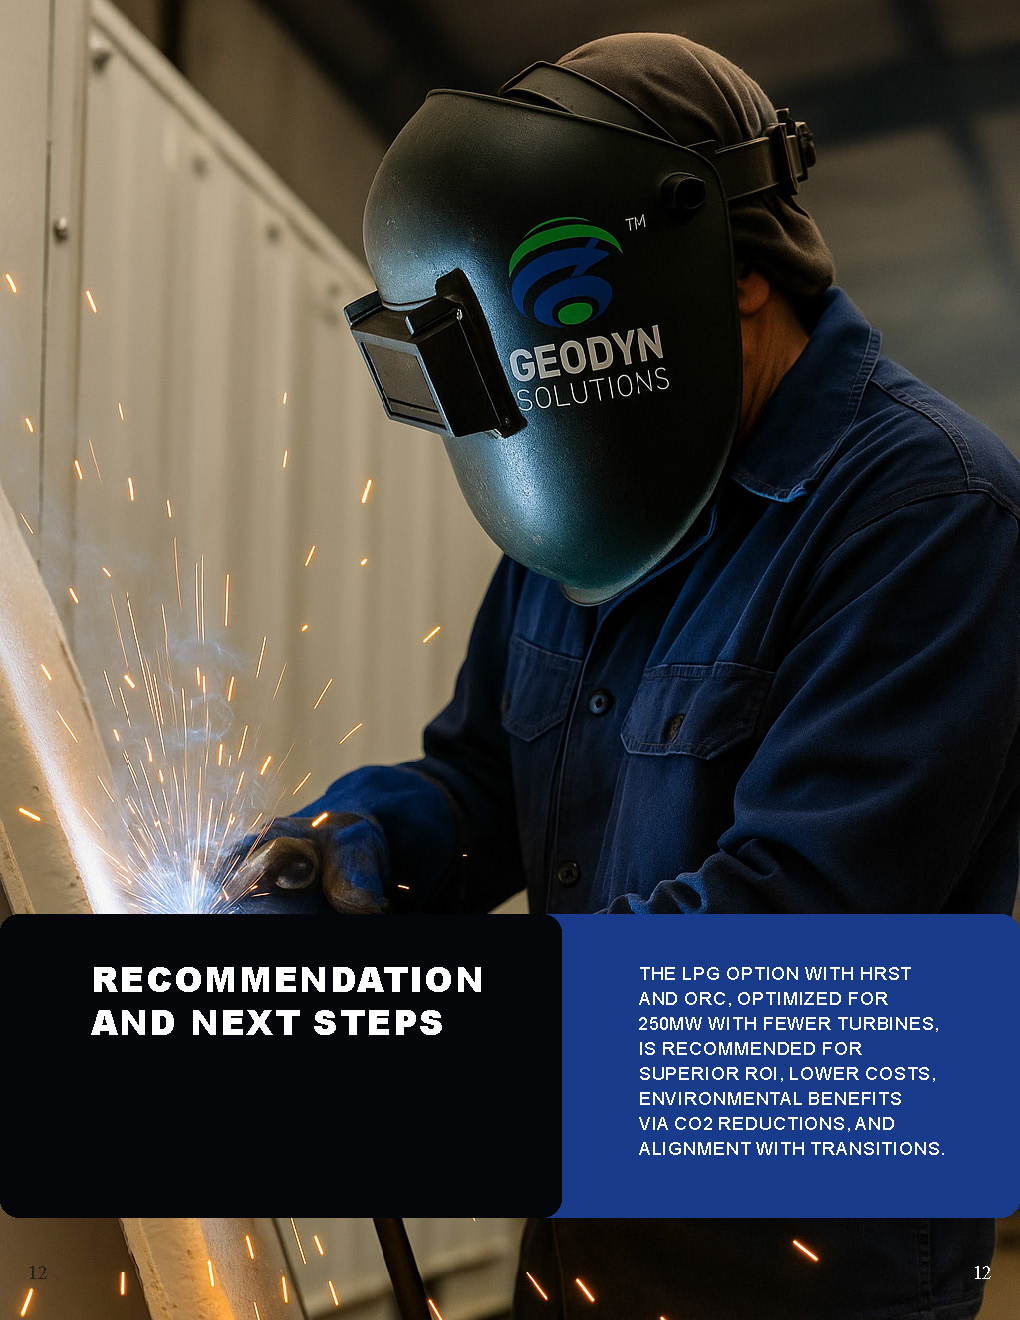
Recommendation and Next Steps
The LPG option with HRST and ORC, optimized for 250MW with fewer turbines, is recommended for superior ROI, lower costs, environmental benefits via CO2 reductions, and alignment with transitions.