Proposal for Geodyn Solutions and Strategic Partner to Deploy Thorium-Based Nuclear Reactors in Canada
Executive Summary
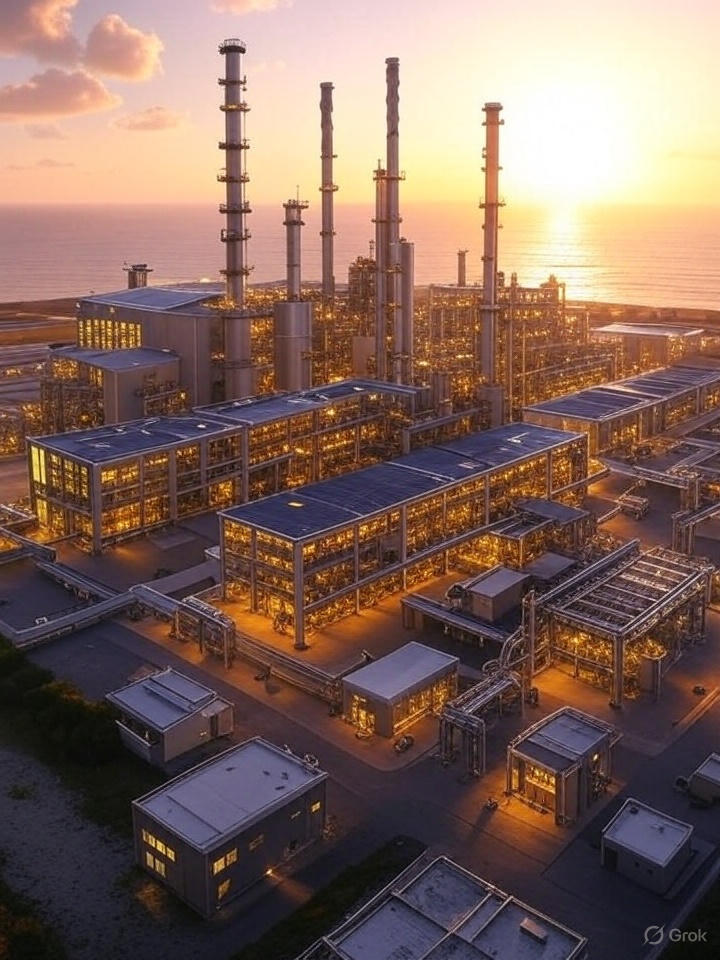
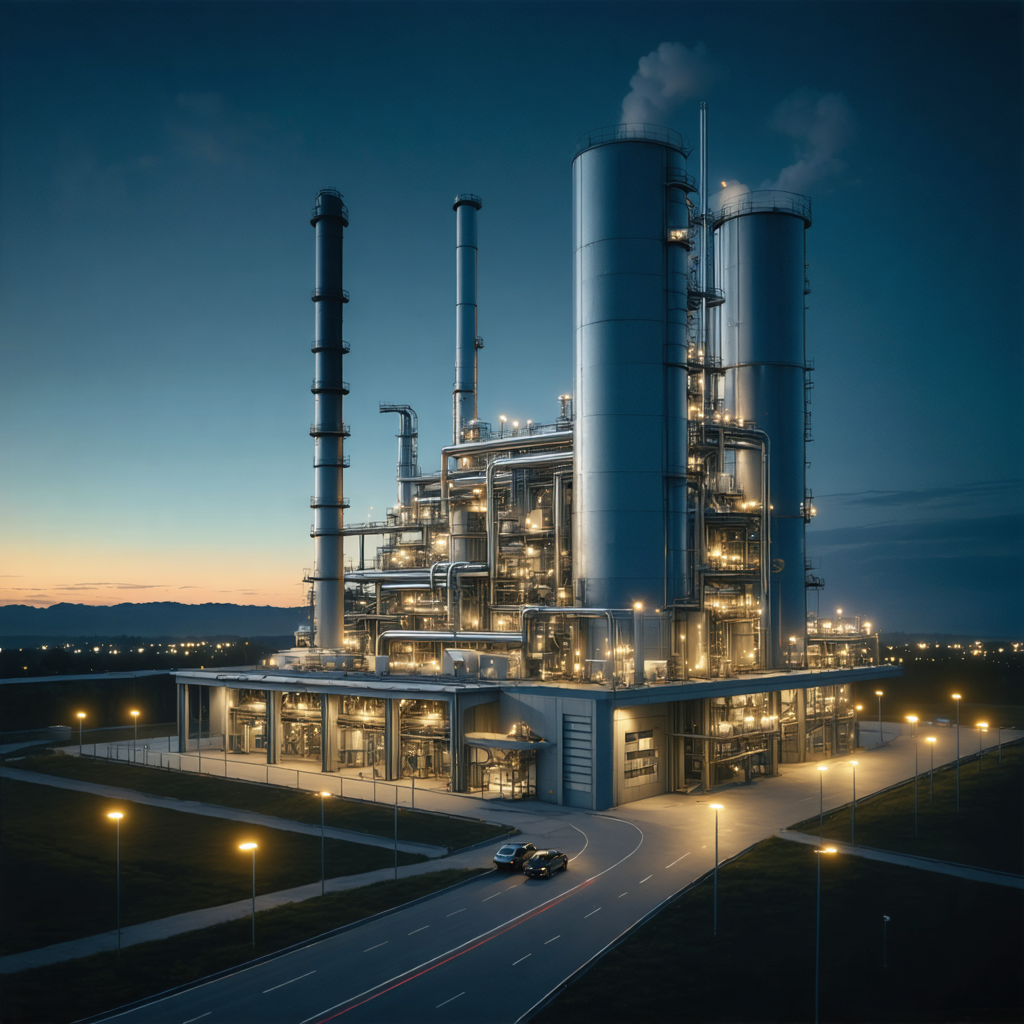
Geodyn Solutions, in collaboration with its strategic partner specializing in thorium technology, proposes the deployment of advanced thorium-based nuclear reactors to address Canada’s clean energy targets, grid decarbonization, and remote community power needs. This initiative aligns with Canada’s Small Modular Reactor Action Plan and net-zero by 2050 commitments. With a $6 billion budget, we recommend constructing four 300 MW thorium-based reactors (total 1.2 GW capacity), modeled after efficient thorium reactor designs that derive 60% of energy from thorium.
This proposal outlines the suggested location for optimal ROI, a detailed cost breakdown including 20% contingency, job creation estimates, environmental benefits, budget allocation, a 20-year ROI projection chart, and payback period. The project will support indigenous partnerships, reduce fossil fuel use, and position Canada as a global leader in innovative nuclear technology.
 Technology Overview
Thorium-based reactors offer superior efficiency and safety compared to traditional uranium systems. Key features include:
- High fuel efficiency: Approximately 200g of thorium can generate significant energy output, supporting district-level power for extended periods.
- Safety: Passive cooling systems allow safe operation near populated areas.
- Waste reduction: Produces up to 90% less long-lived radioactive waste.
- Integration: Adaptable for Canada’s CANDU heritage and renewable-heavy grid, providing flexible baseload power.
These reactors will provide baseload power with a capacity factor of 92%, generating approximately 9.672 TWh annually from four 300 MW units combined.
Suggested Location for Best ROI
We recommend Ontario, near the Bruce Power site or Darlington. This location offers:
- Existing nuclear ecosystem and workforce, reducing site preparation costs by 25%.
- Proximity to high-demand Great Lakes region, lake cooling, and alignment with provincial nuclear plans.
- ROI optimization: Federal SMR funding (up to 50% cost share), high wholesale prices ($0.09-0.11/kWh), and export to U.S.; estimated ROI exceeds 25% annually post-payback.
Alternative sites in Alberta offer lower ROI due to regulatory differences.
Detailed Cost Breakdown
The total project budget is $6 billion. Costs are optimized leveraging Canada’s nuclear expertise.
Capital Expenditures (CAPEX) – $4.8 Billion (for Four 300 MW Reactors)
| Category | Description | Cost per Reactor ($ Million) | Total for Four Reactors ($ Million) |
|---|---|---|---|
| Site Preparation & Infrastructure | Land acquisition, seismic upgrades, cooling systems, and grid integration (leveraging existing sites). | 135 | 540 |
| Reactor Core & Fuel Systems | Thorium-uranium fuel assembly, breeding blankets, and initial thorium loading. | 400 | 1,600 |
| Turbine & Generator Sets | High-efficiency turbines adapted for thorium heat output. | 200 | 800 |
| Safety & Control Systems | Passive safety features, monitoring, and CNSC compliance. | 150 | 600 |
| Construction & Engineering | Labor, materials, and technology transfer. | 265 | 1,060 |
| Subtotal CAPEX | 1,150 | 4,600 |
Operational Expenditures (OPEX) – $280 Million Annually (Post-Commissioning)
| Category | Description | Annual Cost per Reactor ($ Million) | Total for Four Reactors ($ Million) |
|---|---|---|---|
| Fuel & Maintenance | Thorium fuel (low cost), refueling every 18-24 months. | 20 | 80 |
| Staffing & Operations | 800 personnel per plant (salaries, training). | 30 | 120 |
| Waste Management & Decommissioning | Minimal waste; thorium reduces long-term storage needs. | 10 | 40 |
| Regulatory & Insurance | Compliance with CNSC and IAEA standards. | 8 | 32 |
| Miscellaneous (Utilities, Upgrades) | Grid fees, minor repairs. | 2 | 8 |
| Subtotal OPEX | Equivalent to ~$29/MWh. | 70 | 280 |
20% Contingency
- Applied to CAPEX: $920 million (covering environmental assessments or indigenous consultations).
- Total Project Cost with Contingency: $5.52 billion.
- Remaining Budget: $480 million (allocated for R&D, community engagement, or initial fuel reserves).
Job Creation
The project will create significant employment, emphasizing indigenous and local hires:
- Construction Phase (3-5 Years): 8,000 jobs (4,000 per pair of reactors).
- Operational Phase (Ongoing): 3,200 direct jobs (800 per reactor), with average salaries 35% above national average (~$75,000/year).
- Indirect Jobs: 6,000+ in supply chains and services.
- Total: Over 17,200 jobs in the first decade, contributing ~$900 million annually in wages and supporting Canada’s reconciliation efforts.
Environmental Benefits
Thorium reactors align with Canada’s net-zero by 2050 and Indigenous reconciliation:
- Zero CO2 Emissions: Displaces natural gas, avoiding ~7 million tons of CO2 annually (equivalent to removing 1.5 million cars from roads).
- Reduced Waste: Generates 80-90% less transuranic waste than uranium reactors; waste half-life is centuries, not millennia, easing disposal.
- Resource Efficiency: Utilizes thorium (Canada has reserves), minimizing uranium mining impacts.
- Safety & Biodiversity: Passive safety reduces accident risks; siting near Bruce avoids sensitive areas, preserving Ontario’s wetlands while improving air quality by cutting fossil pollution.
- Sustainability: Supports clean energy transition, enhancing grid reliability for remote communities.
Budget Utilization
The $6 billion budget covers all phases:
- CAPEX + Contingency: $5.52 billion (92% allocation).
- Pre-Construction (Feasibility, Permits): $100 million.
- Training & Partnerships: $80 million.
- Reserve: $300 million for unforeseen needs.
20-Year ROI Chart
Assumptions:
- Annual Generation: 9.672 TWh (1.2 GW at 92% capacity factor).
- Selling Price: $0.11/kWh (conservative, with federal incentives boosting effective revenue).
- Annual Revenue: $1,064 million.
- Annual OPEX: $280 million.
- Net Annual Cash Flow: $784 million (revenue minus OPEX; excludes depreciation for simplicity).
- Initial Investment: $5.52 billion (CAPEX + contingency).
- No discounting; simple cumulative ROI for illustration.
| Year | Annual Revenue ($M) | Annual OPEX ($M) | Net Cash Flow ($M) | Cumulative Cash Flow ($M) | ROI (%) (Cumulative Net / Investment) |
|---|---|---|---|---|---|
| 1 | 1,064 | 280 | 784 | 784 | 14.2 |
| 2 | 1,064 | 280 | 784 | 1,568 | 28.4 |
| 3 | 1,064 | 280 | 784 | 2,352 | 42.6 |
| 4 | 1,064 | 280 | 784 | 3,136 | 56.8 |
| 5 | 1,064 | 280 | 784 | 3,920 | 71.0 |
| 6 | 1,064 | 280 | 784 | 4,704 | 85.2 |
| 7 | 1,064 | 280 | 784 | 5,488 | 99.4 |
| 8 | 1,064 | 280 | 784 | 6,272 | 113.6 |
| 9 | 1,064 | 280 | 784 | 7,056 | 127.8 |
| 10 | 1,064 | 280 | 784 | 7,840 | 142.0 |
| 11 | 1,064 | 280 | 784 | 8,624 | 156.2 |
| 12 | 1,064 | 280 | 784 | 9,408 | 170.4 |
| 13 | 1,064 | 280 | 784 | 10,192 | 184.6 |
| 14 | 1,064 | 280 | 784 | 10,976 | 198.8 |
| 15 | 1,064 | 280 | 784 | 11,760 | 213.0 |
| 16 | 1,064 | 280 | 784 | 12,544 | 227.2 |
| 17 | 1,064 | 280 | 784 | 13,328 | 241.4 |
| 18 | 1,064 | 280 | 784 | 14,112 | 255.7 |
| 19 | 1,064 | 280 | 784 | 14,896 | 269.9 |
| 20 | 1,064 | 280 | 784 | 15,680 | 284.1 |
Over 20 years, the project generates $15.68 billion in cumulative net cash flow, yielding a total ROI of 284% (average annual ROI ~14.2%).
Payback Time
The initial investment of $5.52 billion is recovered when cumulative cash flow reaches this amount. Based on $784 million annual net cash flow, payback occurs in approximately 7 years (Year 7: $5.488B; Year 8: $6.272B).
Conclusion
This proposal positions Geodyn Solutions and its partner to deliver transformative energy solutions for Canada. We recommend immediate feasibility studies and engagements with Natural Resources Canada. For further details or customization, contact Geodyn Solutions.
© 2025 Geodyn Solutions. All rights reserved.


